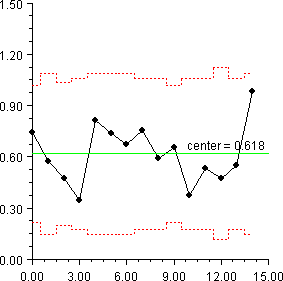
This class can be used either as an applet or as an application.
import com.imsl.chart.*;
import com.imsl.chart.qc.*;

public class SChartEx1 extends javax.swing.JApplet {
    static private final double data[][] = {
        {23.97, 24.08, 23.16, 23.49, 24.73, 25.26, 22.97, 23.12, 24.66, 24.20, 24.62, 24.56},
        {24.20, 24.50, 23.45, 24.05, 23.75, 23.89, 24.83, 25.21, 23.70},
        {23.73, 22.70, 23.54, 24.37, 23.74, 24.08, 23.95, 24.20, 23.43, 24.26, 23.61},
        {23.46, 23.14, 23.73, 24.29, 24.13, 23.62, 24.08, 23.73, 23.91, 23.65},
        {23.95, 22.95, 24.72, 24.40, 22.82, 22.66, 22.71, 23.41, 22.56},
        {24.13, 24.28, 23.84, 24.55, 22.58, 24.47, 23.63, 22.64, 24.12},
        {23.69, 24.19, 24.76, 23.83, 22.60, 24.35, 22.96, 23.81, 23.46},
        {24.35, 23.11, 25.24, 24.10, 23.47, 23.55, 23.91, 24.08, 22.45, 24.13},
        {24.98, 24.58, 23.52, 23.55, 23.67, 24.25, 23.85, 23.08, 23.44, 23.43},
        {23.90, 24.04, 24.29, 23.62, 23.29, 23.16, 24.34, 24.37, 24.19, 24.33, 22.17, 23.66},
        {23.51, 23.87, 23.29, 23.96, 23.06, 23.47, 23.53, 22.87, 23.38, 22.86},
        {23.13, 23.17, 23.40, 23.68, 23.37, 24.40, 24.64, 24.16, 24.17, 23.88},
        {23.52, 24.23, 24.25, 23.83, 22.82, 23.93, 23.55, 23.40},
        {23.66, 23.59, 23.79, 24.07, 23.65, 23.73, 25.12, 23.65, 23.23, 23.13},
        {23.04, 23.75, 22.84, 23.46, 21.72, 24.73, 23.88, 23.34, 24.98}
    };

    public void init() {
        Chart chart = new Chart(this);
        JPanelChart panel = new JPanelChart(chart);
        getContentPane().add(panel, java.awt.BorderLayout.CENTER);
        setup(chart);
    }

    static private void setup(Chart chart) {
       AxisXY axis = new AxisXY(chart);
       new SChart(axis, data);
    }


    public static void main(String argv[]) {
        JFrameChart frame = new JFrameChart();
        SChartEx1.setup(frame.getChart());
        frame.setVisible(true);
    }
}
