JMSL Chart Programmer's Guide


JMSL Chart Programmer's Guide
|
2D Drawing Elements >> Background |
|
Background
Background controls the drawing of the chart's background. It is created by
Chart as its child. It can be retrieved from a Chart object using the
Chart.getBackground() method.
The fill area attributes in the Background node determine how the background
is drawn (see Fill Area Attributes).
The attribute FillType has the global default value of FILL_TYPE_SOLID.
The attribute FillColor attribute is set to Color.white in this node.
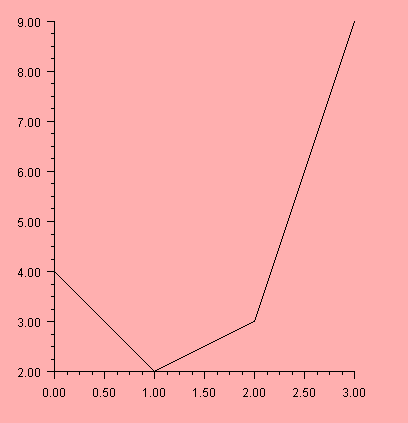
Solid Color Background
To set the background to a solid color:
FillType to FILL_TYPE_SOLID, and
FillColor to the desired color.
For example the following code sets the background to pink. To view chart in color please see the online documentation.
import com.imsl.chart.*;

public class SampleBackgroundSolid extends JFrameChart {

    public SampleBackgroundSolid() {
        Chart chart = getChart();
        chart.getBackground().setFillType(ChartNode.FILL_TYPE_SOLID);
        chart.getBackground().setFillColor(java.awt.Color.pink);
        AxisXY axis = new AxisXY(chart);
        double y[] = {4, 2, 3, 9};
        new Data(axis, y);
    }

    public static void main(String argv[]) {
        new SampleBackgroundSolid().setVisible(true);
    }
}
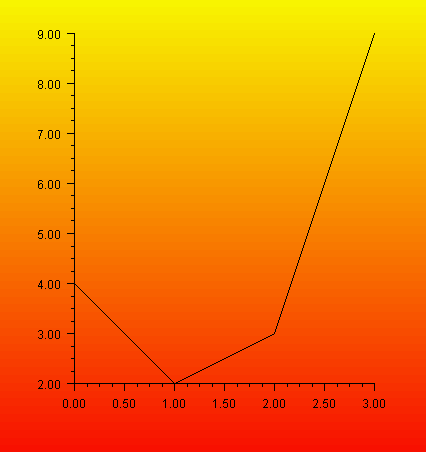
Gradient Color Background
To set the background to a color gradient:
FillType to FILL_TYPE_GRADIENT, and
Gradient to the desired color gradient specification.
For example the following code uses a yellow-to-red vertical gradient for the background setting. See Fill Area Attributes for more information on gradients.
import com.imsl.chart.*;
import java.awt.Color;

public class SampleBackgroundGradient extends JFrameChart {

    public SampleBackgroundGradient() {
        Chart chart = getChart();
        chart.getBackground().setFillType(ChartNode.FILL_TYPE_GRADIENT);
        chart.getBackground().setGradient(Color.yellow, Color.yellow,
            Color.red, Color.red);
        AxisXY axis = new AxisXY(chart);
        double y[] = {4, 2, 3, 9};
        new Data(axis, y);
    }

    public static void main(String argv[]) {
        new SampleBackgroundGradient().setVisible(true);
    }
}
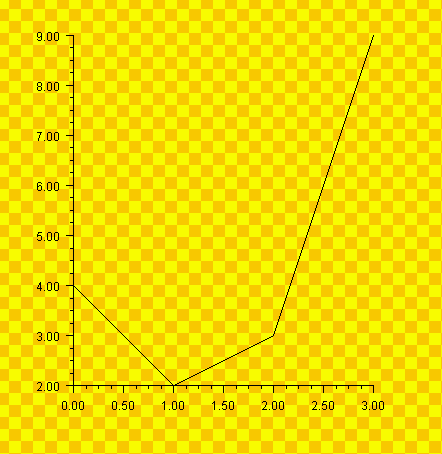
Pattern Background
To set the background to a color pattern:
FillType to FILL_TYPE_PAINT, and
FillPaint to the desired pattern.
For example the following code sets the background to yellow/orange checkerboard pattern. See Fill Area Attributes for more information on patterns.
import com.imsl.chart.*;
import java.awt.Color;
import java.awt.Paint;

public class SampleBackgroundPaint extends JFrameChart {

    public SampleBackgroundPaint() {
        Chart chart = getChart();
        chart.getBackground().setFillType(ChartNode.FILL_TYPE_PAINT);
        Paint paint = FillPaint.checkerboard(24, Color.yellow,Color.orange);
        chart.getBackground().setFillPaint(paint);
        AxisXY axis = new AxisXY(chart);
        double y[] = {4, 2, 3, 9};
        new Data(axis, y);
    }

    public static void main(String argv[]) {
        new SampleBackgroundPaint().setVisible(true);
    }
}
| © Visual Numerics, Inc. All rights reserved. |
|