JMSL Chart Programmer's Guide


JMSL Chart Programmer's Guide
|
Charting 2D Types >> Heatmap |
|
Heatmap
A heatmap divides a rectangle into subrectangles. The color of each subrectangle is determined by the value of a data array and a colormap.
If the data array is m by n then there are m divisions along the x-axis and n divisions along the y-axis.
A colormap is a mapping from [0,1] to color values. The blue-red colormap, used in the example below, maps 0 to red and 1 to dark blue and interpolates between these endpoints values. The heatmap maps the minimum data value to the color corresponding to 0 and the highest data value to the color corresponding to 1.
The Heatmap class has a special legend for colormaps. It displays the color values as a gradient labeled with corresponding data values.
Example
In this example a two-dimensional array of data is plotted as a heatmap. The "red-
blue" colormap is used. The heatmap legend is enabled by settings its Paint
attribute to true.
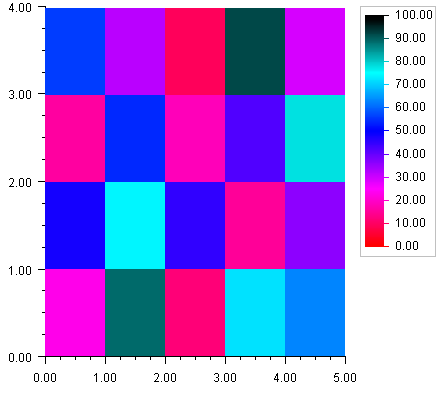
import com.imsl.chart.*;public class SampleHeatmap extends JFrameChart {public SampleHeatmap() {Chart chart = getChart();AxisXY axis = new AxisXY(chart);double xmin = 0.0;double xmax = 5.0;double ymin = 0.0;double ymax = 4.0;double zmin = 0.0;double zmax = 100.0;double data[][] = {{23, 48, 16, 56},{89, 74, 54, 32},{12, 45, 18, 9},{72, 15, 42, 92},{63, 36, 78, 29}};Heatmap heatmap = new Heatmap(axis, xmin, xmax, ymin, ymax,zmin, zmax, data, Colormap.BLUE_RED);heatmap.getHeatmapLegend().setPaint(true);}public static void main(String argv[]) {new SampleHeatmap().setVisible(true);}}
| © Visual Numerics, Inc. All rights reserved. |
|