JMSL Chart Programmer's Guide


JMSL Chart Programmer's Guide
|
Quality Control and Improvement Charts >> PChart |
|
PChart
The PChart plots the proportion or fraction of defective products.
The production process is assumed to be stable and successive units are assumed independent. So each unit produced is a realization of a Bernoulli random variable with parameter p, the proportion defective.
The control limits are at
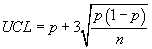

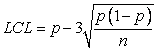
Center to p.
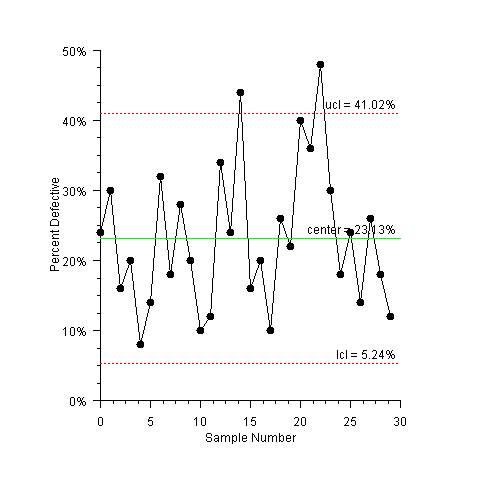
PChart Example
Defects in manufacturing of orange juice cans are measured. The number of defects in samples of 50 cans is counted (Montgomery 290).
The y-axis labels and the title on the control limits have been changed to use a percentage format.
(Download Code)import com.imsl.chart.*;
import com.imsl.chart.qc.*;
public class SamplePChart extends JFrameChart {
static final int sampleSize = 50;
static final int numberDefects[] = {
12, 15, 8, 10, 4, 7, 16, 9, 14, 10, 5, 6, 17, 12, 22, 8,
10, 5, 13, 11, 20, 18, 24, 15, 9, 12, 7, 13, 9, 6
};
public SamplePChart() {
Chart chart = getChart();
AxisXY axis = new AxisXY(chart);
PChart pchart = new PChart(axis, sampleSize, numberDefects);
pchart.getLowerControlLimit().setTitle("lcl = {0,number,0.00%}");
pchart.getCenterLine().setTitle("center = {0,number,0.00%}");
pchart.getUpperControlLimit().setTitle("ucl = {0,number,0.00%}");
axis.getAxisX().getAxisTitle().setTitle("Sample Number");
axis.getAxisX().getAxisLabel().setTextFormat("0");
axis.getAxisY().getAxisTitle().setTitle("Percent Defective");
axis.getAxisY().getAxisLabel().setTextFormat("percent");
}
public static void main(String argv[]) {
new SamplePChart().setVisible(true);
}
}
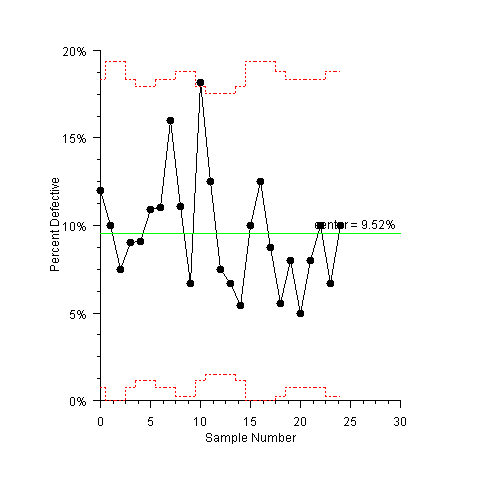
PChartUnequal Example
In this example a PChart is computed with unequal sample sizes. The upper and
lower control limits are now stair step lines (Montgomery 300).
The y-axis labels and the title on the center line have been changed to use a percentage format.
(Download Code)import com.imsl.chart.*;
import com.imsl.chart.qc.*;
public class SamplePChartUnequal extends JFrameChart {
static final int sampleSize[] = {
100, 80, 80, 100, 110, 110, 100, 100, 90, 90, 110, 120, 120, 120, 110,
80, 80, 80, 90, 100, 100, 100, 100, 90, 90
};
static final int numberDefects[] = {
12, 8, 6, 9, 10, 12, 11, 16, 10, 6, 20, 15, 9, 8, 6, 8, 10, 7, 5, 8, 5,
8, 10, 6, 9
};
public SamplePChartUnequal() {
Chart chart = getChart();
AxisXY axis = new AxisXY(chart);
PChart pchart = new PChart(axis, sampleSize, numberDefects);
pchart.getCenterLine().setTitle("center = {0,number,0.00%}");
axis.getAxisX().getAxisTitle().setTitle("Sample Number");
axis.getAxisX().getAxisLabel().setTextFormat("0");
axis.getAxisY().getAxisTitle().setTitle("Percent Defective");
axis.getAxisY().getAxisLabel().setTextFormat("percent");
axis.getAxisY().setWindow(0.0, 0.2);
axis.getAxisY().setAutoscaleInput(0);
}
public static void main(String argv[]) {
new SamplePChartUnequal().setVisible(true);
}
}
| © Visual Numerics, Inc. All rights reserved. |
|