Appendix C: Picture-in-Picture
Pitcure-in-Picture
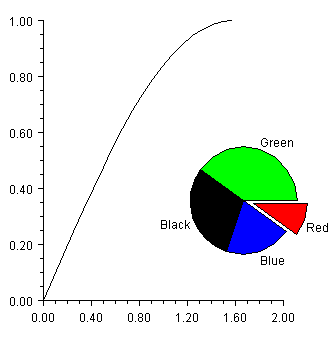
The picture-in-picture effect can be obtained by using the Viewport attribute. This sets the fraction of the screen into which the chart is to be drawn. The Viewport attribute's value is a double[4] containing {xmin, xmax, ymin, ymax}, on a [0,1] by [0,1] grid with (0,0) at the top-left.
import com.imsl.chart.*;
import java.awt.Color;
public class SamplePnP extends JFrameChart {
public SamplePnP() {
Chart chart = getChart();
createLineChart(chart);
createPieChart(chart);
}
private void createLineChart(Chart chart) {
AxisXY axis = new AxisXY(chart);
int npoints = 20;
double dx = 0.5 * Math.PI/(npoints-1);
double x[] = new double[npoints];
double y[] = new double[npoints];
for (int i = 0; i < npoints; i++){
x[i] = i * dx;
y[i] = Math.sin(x[i]);
}
new Data(axis, x, y);
}
private void createPieChart(Chart chart) {
double y[] = {10., 20., 30., 40.};
Pie pie = new Pie(chart, y);
pie.setLabelType(pie.LABEL_TYPE_TITLE);
pie.setViewport(0.5, 0.9, 0.3, 0.8);
PieSlice[] slice = pie.getPieSlice();
slice[0].setTitle("Red");
slice[0].setFillColor(Color.red);
slice[0].setExplode(.2);
slice[1].setTitle("Blue");
slice[1].setFillColor(Color.blue);
slice[2].setTitle("Black");
slice[2].setFillColor(Color.black);
slice[3].setTitle("Green");
slice[3].setFillColor(Color.green);
}
public static void main(String argv[]) {
new SamplePnP().setVisible(true);
}
}
|
PHONE: 713.784.3131 FAX:713.781.9260 |