CuSum is the cumulative sum control chart.
It plots the cumulative sum of the deviations of the expected value. If
 is the expected mean for a process and
 are the sample means then the cumulative sum is

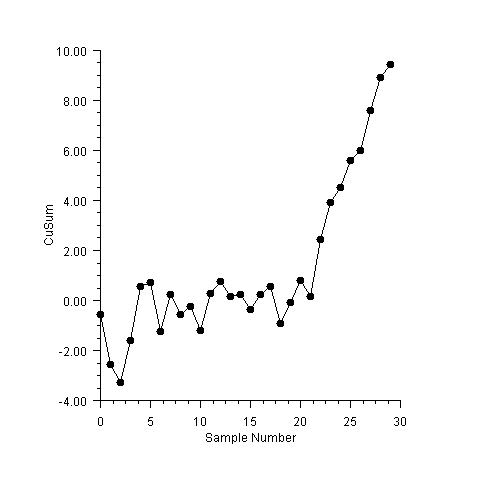
CuSum Example
The data used is the same as for the EWMA example.
import com.imsl.chart.*;
import com.imsl.chart.qc.*;
public class SampleCuSum extends JFrameChart {
public SampleCuSum() {
Chart chart = getChart();
AxisXY axis = new AxisXY(chart);
CuSum cusum = new CuSum(axis, SampleEWMA.data);
cusum.setExpectedMean(10.0);
axis.getAxisX().getAxisTitle().setTitle("Sample Number");
axis.getAxisX().getAxisLabel().setTextFormat("0");
axis.getAxisY().getAxisTitle().setTitle("CuSum");
}
public static void main(String argv[]) {
new SampleCuSum().setVisible(true);
}
}
|
PHONE: 713.784.3131 FAX:713.781.9260 |