A function plot shows the value of a function f(x) over an interval [a,b]. The function must be defined as an implementation of the ChartFunction interface. A Data node constructor creates a line chart from the function. The look of the function is controlled by the line attributes.
The ChartFunction interface requires that the function name be "f", that the function have a single double argument and that it return a double.
Example
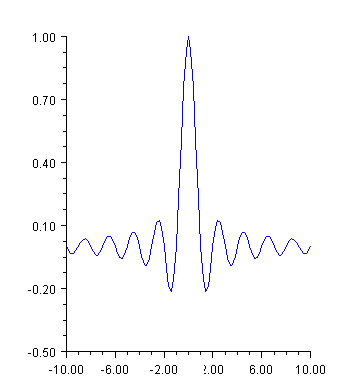
This example plots the sinc function on the interval [-10,10]. The sinc function is defined to be sin(πx)/πx. In this example, sinc is an anonymous inner class that implements ChartFunction. This is required by the function Data constructor. In the code, the case x = 0 is handled specially to avoid returning NaN.
import com.imsl.chart.*;
import java.awt.Color;
public class SampleFunction extends JFrameChart {
public SampleFunction() {
Chart chart = getChart();
AxisXY axis = new AxisXY(chart);
ChartFunction sinc = new ChartFunction() {
public double f(double x) {
if (x == 0.0) return 1.0;
return Math.sin(Math.PI*x) / (Math.PI*x);
}
};
Data data = new Data(axis, sinc, -10.0, 10.0);
data.setLineColor(Color.blue);
}
public static void main(String argv[]) {
new SampleFunction().setVisible(true);
}
}
Histogram Example
For another example of a ChartFunction, see Histogram.
Spline Chart
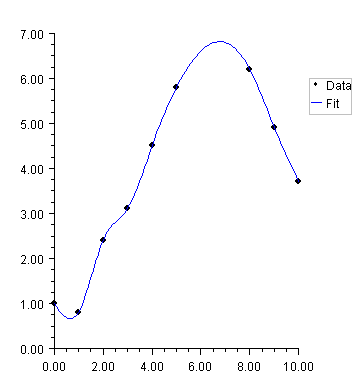
This example shows raw data points, as markers, and their fit to a shape preserving spline. The spline is computed using CsShape found in the JMSL Math package (which extends Spline). The ChartSpline class wraps the Spline into a ChartFunction. This example also enables the Legend.
import com.imsl.chart.*;
import com.imsl.math.CsShape;
import java.awt.Color;
public class SampleSpline extends JFrameChart {
public SampleSpline() {
try {
Chart chart = getChart();
AxisXY axis = new AxisXY(chart);
chart.getLegend().setPaint(true);
double x[] = {0, 1, 2, 3, 4, 5, 8, 9, 10};
double y[] = {1.0, 0.8, 2.4, 3.1, 4.5, 5.8, 6.2, 4.9, 3.7};
Data dataMarker = new Data(axis, x, y);
dataMarker.setTitle("Data");
dataMarker.setDataType(Data.DATA_TYPE_MARKER);
dataMarker.setMarkerType(Data.MARKER_TYPE_FILLED_CIRCLE);
CsShape spline = new CsShape(x, y);
Data dataSpline =
new Data(axis, new ChartSpline(spline), 0., 10.);
dataSpline.setTitle("Fit");
dataSpline.setLineColor(Color.blue);
} catch (com.imsl.IMSLException e) {
e.printStackTrace();
}
}
public static void main(String argv[]) {
new SampleSpline().setVisible(true);
}
}
|
PHONE: 713.784.3131 FAX:713.781.9260 |