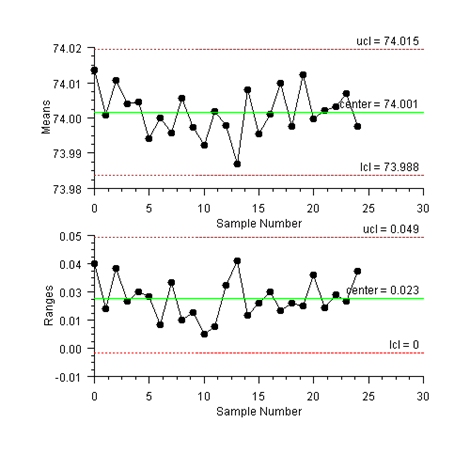
XbarRCombo Example
This example combines the XbarR chart with the corresponding RChart into a single chart. This is done by adjusting the Viewport attribute values for the two subcharts (Montgomery 215).
import com.imsl.chart.*;
import com.imsl.chart.qc.*;
public class SampleXbarRCombo extends JFrameChart {
public SampleXbarRCombo() {
Chart chart = getChart();
ShewhartControlChart charts[] =
XbarR.createCharts(chart, SampleXbarS.diameter);
AxisXY axis = (AxisXY)(charts[0].getAxis());
axis.getAxisY().setAutoscaleInput(axis.AUTOSCALE_OFF);
axis.getAxisY().setWindow(73.985, 74.015);
}
public static void main(String argv[]) {
new SampleXbarRCombo().setVisible(true);
}
}

|
PHONE: 713.784.3131 FAX:713.781.9260 |