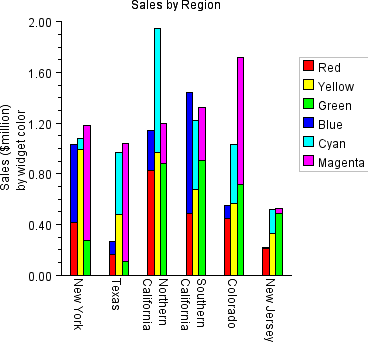
Example: Stacked Bar Chart
A stacked bar chart is constructed in this example. Bar labels and colors are set and axis labels are set. This class can be used either as an applet or as an application.
import com.imsl.chart.*;
import com.imsl.stat.Random;
import java.awt.Color;

public class BarEx1 extends javax.swing.JApplet {

    private JPanelChart panel;

    public void init() {
        Chart chart = new Chart(this);
        panel = new JPanelChart(chart);
        getContentPane().add(panel, java.awt.BorderLayout.CENTER);
        setup(chart);
    }

    static private void setup(Chart chart) {
        AxisXY axis = new AxisXY(chart);

        int nStacks = 2;
        int nGroups = 3;
        int nItems = 6;

        //	Generate some random data
        Random r = new Random(123457);
        double y[][][] = new double[nStacks][nGroups][nItems];

        for (int istack = 0; istack < y.length; istack++) {
            for (int jgroup = 0; jgroup < y[istack].length; jgroup++) {
                for (int kitem = 0; kitem < y[istack][jgroup].length;
                        kitem++) {
                    y[istack][jgroup][kitem] = r.nextDouble();
                }
            }
        }

        //	Create an instance of a Bar Chart
        Bar bar = new Bar(axis, y);

        //	Set the Bar Chart Title
        chart.getChartTitle().setTitle("Sales by Region");

        //	Set the fill outline type;
        bar.setFillOutlineType(Bar.FILL_TYPE_SOLID);

        //	Set the Bar Item fill colors
        bar.getBarSet(0, 0).setFillColor(Color.red);
        bar.getBarSet(0, 1).setFillColor(Color.yellow);
        bar.getBarSet(0, 2).setFillColor(Color.green);
        bar.getBarSet(1, 0).setFillColor(Color.blue);
        bar.getBarSet(1, 1).setFillColor(Color.cyan);
        bar.getBarSet(1, 2).setFillColor(Color.magenta);

        chart.getLegend().setPaint(true);
        bar.getBarSet(0, 0).setTitle("Red");
        bar.getBarSet(0, 1).setTitle("Yellow");
        bar.getBarSet(0, 2).setTitle("Green");
        bar.getBarSet(1, 0).setTitle("Blue");
        bar.getBarSet(1, 1).setTitle("Cyan");
        bar.getBarSet(1, 2).setTitle("Magenta");

        // Setup the vertical axis for a labeled bar chart.
        String labels[] = {
            "New York",
            "Texas",
            "Northern\nCalifornia",
            "Southern\nCalifornia",
            "Colorado",
            "New Jersey"
        };
        bar.setLabels(labels, bar.BAR_TYPE_VERTICAL);

        //	Set the text angle
        axis.getAxisX().getAxisLabel().setTextAngle(270);

        //	Set the Y axis title
        axis.getAxisY().getAxisTitle().setTitle("Sales ($million)\nby "
                + "widget color");
    }

    public static void main(String argv[]) {
        JFrameChart frame = new JFrameChart();
        BarEx1.setup(frame.getChart());
        frame.setVisible(true);
    }
}
Output
Link to Java source.