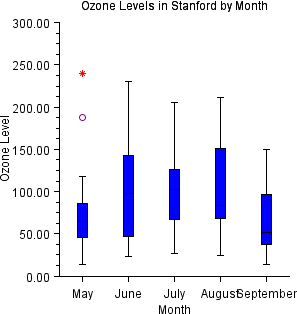
Example: Box Plot Chart
A simple box plot chart is constructed in this example. Display of far and outside values is turned on.
import com.imsl.chart.*;

public class BoxPlotEx1 extends javax.swing.JApplet {

    public void init() {
        Chart chart = new Chart(this);
        JPanelChart panel = new JPanelChart(chart);
        getContentPane().add(panel, java.awt.BorderLayout.CENTER);
        setup(chart);
    }

    static private void setup(Chart chart) {
        double obs[][] = {
            {66.0, 52.0, 49.0, 64.0, 68.0, 26.0, 86.0, 52.0,
                43.0, 75.0, 87.0, 188.0, 118.0, 103.0, 82.0,
                71.0, 103.0, 240.0, 31.0, 40.0, 47.0, 51.0, 31.0,
                47.0, 14.0, 71.0},
            {61.0, 47.0, 196.0, 131.0, 173.0, 37.0, 47.0,
                215.0, 230.0, 69.0, 98.0, 125.0, 94.0, 72.0,
                72.0, 125.0, 143.0, 192.0, 122.0, 32.0, 114.0,
                32.0, 23.0, 71.0, 38.0, 136.0, 169.0},
            {152.0, 201.0, 134.0, 206.0, 92.0, 101.0, 119.0,
                124.0, 133.0, 83.0, 60.0, 124.0, 142.0, 124.0, 64.0,
                75.0, 103.0, 46.0, 68.0, 87.0, 27.0,
                73.0, 59.0, 119.0, 64.0, 111.0},
            {80.0, 68.0, 24.0, 24.0, 82.0, 100.0, 55.0, 91.0,
                87.0, 64.0, 170.0, 86.0, 202.0, 71.0, 85.0, 122.0,
                155.0, 80.0, 71.0, 28.0, 212.0, 80.0, 24.0,
                80.0, 169.0, 174.0, 141.0, 202.0},
            {113.0, 38.0, 38.0, 28.0, 52.0, 14.0, 38.0, 94.0,
                89.0, 99.0, 150.0, 146.0, 113.0, 38.0, 66.0, 38.0,
                80.0, 80.0, 99.0, 71.0, 42.0, 52.0, 33.0, 38.0,
                24.0, 61.0, 108.0, 38.0, 28.0}
        };
        String xLabels[] = {"May", "June", "July", "August", "September"};

        //	 Create an instance of a BoxPlot Chart
        AxisXY axis = new AxisXY(chart);
        BoxPlot boxPlot = new BoxPlot(axis, obs);
        boxPlot.setLabels(xLabels);

        // Customize the fill color and the outside and far markers
        boxPlot.getBodies().setFillColor(java.awt.Color.blue);
        boxPlot.getOutsideMarkers().
                setMarkerType(boxPlot.MARKER_TYPE_HOLLOW_CIRCLE);
        boxPlot.getOutsideMarkers().setMarkerColor("purple");
        boxPlot.getFarMarkers().setMarkerType(boxPlot.MARKER_TYPE_ASTERISK);
        boxPlot.getFarMarkers().setMarkerColor(java.awt.Color.red);

        // Set titles
        chart.getChartTitle().setTitle("Ozone Levels in Stanford by Month");
        axis.getAxisX().getAxisTitle().setTitle("Month");
        axis.getAxisY().getAxisTitle().setTitle("Ozone Level");
    }

    public static void main(String argv[]) {
        JFrameChart frame = new JFrameChart();
        BoxPlotEx1.setup(frame.getChart());
        frame.setVisible(true);
    }
}
Output
Link to Java source.