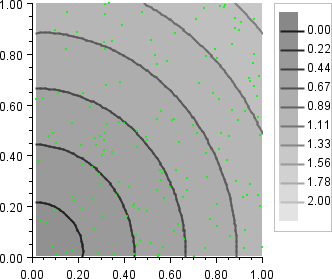
In this example, a contour chart is created from 150, randomly choosen, scattered data points. The function is ![]() , so the level curve should be circles.
, so the level curve should be circles.
The input data is shown on top of the contours as small green circles. The chart data nodes are drawn in the order in which they are added, so the input data marker node has to be added to the axis after the contour, so that the markers are not hidden.
import com.imsl.chart.*;
import java.util.Random;

public class ContourEx2 extends javax.swing.JApplet {

    private JPanelChart panel;

    public void init() {
        Chart chart = new Chart(this);
        panel = new JPanelChart(chart);
        getContentPane().add(panel, java.awt.BorderLayout.CENTER);
        setup(chart);
    }

    static private void setup(Chart chart) {
        int n = 150;

        // Allocate space
        double x[] = new double[n];
        double y[] = new double[n];
        double z[] = new double[n];

        // Evaluate the function at n random points
        Random random = new Random(123457);
        for (int k = 0; k < n; k++) {
            x[k] = random.nextDouble();
            y[k] = random.nextDouble();
            z[k] = Math.sqrt(x[k] * x[k] + y[k] * y[k]);
        }

        // Setup the contour plot and its legend
        AxisXY axis = new AxisXY(chart);
        Contour contour = new Contour(axis, x, y, z);
        contour.getContourLegend().setPaint(true);

        // Show the input data points as small green circles
        Data dataPoints = new Data(axis, x, y);
        dataPoints.setDataType(Data.DATA_TYPE_MARKER);
        dataPoints.setMarkerType(Data.MARKER_TYPE_FILLED_CIRCLE);

        dataPoints.setMarkerColor(java.awt.Color.green);
        dataPoints.setMarkerSize(0.5);
    }

    public static void main(String argv[]) {
        JFrameChart frame = new JFrameChart();
        ContourEx2.setup(frame.getChart());
        frame.setVisible(true);
    }
}