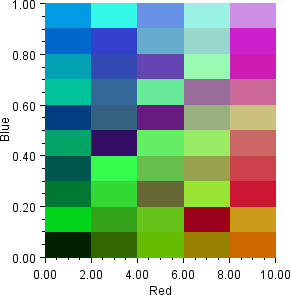
Example: Heatmap from Color array
A 5 by 10 array of Color
objects is created by linearly interpolating red along the x-axis, blue along the y-axis and mixing in a random amount of green. The data range is set to [0,10] by [0,1].
import com.imsl.chart.*;
import java.awt.Color;
import java.util.Random;

public class HeatmapEx1 extends javax.swing.JApplet {

    public void init() {
        Chart chart = new Chart(this);
        JPanelChart panel = new JPanelChart(chart);
        getContentPane().add(panel, java.awt.BorderLayout.CENTER);
        setup(chart);
    }

    static private void setup(Chart chart) {
        AxisXY axis = new AxisXY(chart);

        double xmin = 0.0;
        double xmax = 10.0;
        double ymin = 0.0;
        double ymax = 1.0;

        int nxRed = 5;
        int nyBlue = 10;
        Random random = new Random(123457L);
        Color color[][] = new Color[nxRed][nyBlue];
        for (int i = 0; i < nxRed; i++) {
            for (int j = 0; j < nyBlue; j++) {
                int r = (int) (255. * i / nxRed);
                int g = random.nextInt(255);
                int b = (int) (255. * j / nyBlue);
                color[i][j] = new Color(r, g, b);
            }
        }
        Heatmap heatmap = new Heatmap(axis, xmin, xmax, ymin, ymax, color);
        axis.getAxisX().getAxisTitle().setTitle("Red");
        axis.getAxisY().getAxisTitle().setTitle("Blue");
    }

    public static void main(String argv[]) {
        JFrameChart frame = new JFrameChart();
        HeatmapEx1.setup(frame.getChart());
        frame.setVisible(true);
    }
}
Output
Link to Java source.