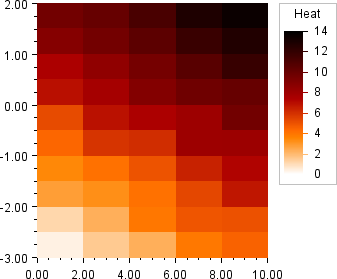
The legend is enabled by setting its paint attribute to true.
import com.imsl.chart.*;
import java.util.Random;

public class HeatmapEx2 extends javax.swing.JApplet {

    public void init() {
        Chart chart = new Chart(this);
        JPanelChart panel = new JPanelChart(chart);
        getContentPane().add(panel, java.awt.BorderLayout.CENTER);
        setup(chart);
    }

    static private void setup(Chart chart) {
        AxisXY axis = new AxisXY(chart);

        int nx = 5;
        int ny = 10;
        double xmin = 0.0;
        double xmax = 10.0;
        double ymin = -3.0;
        double ymax = 2.0;
        double fmin = 0.0;
        double fmax = nx + ny - 1;

        double data[][] = new double[nx][ny];
        Random random = new Random(123457L);
        for (int i = 0; i < nx; i++) {
            for (int j = 0; j < ny; j++) {
                data[i][j] = i + j + random.nextDouble();
            }
        }
        Heatmap heatmap = new Heatmap(axis, xmin, xmax, ymin, ymax,
                fmin, fmax, data, Colormap.RED_TEMPERATURE);
        heatmap.getHeatmapLegend().setPaint(true);
        heatmap.getHeatmapLegend().setTitle("Heat");
        heatmap.getHeatmapLegend().setTextFormat("0");
    }

    public static void main(String argv[]) {
        JFrameChart frame = new JFrameChart();
        HeatmapEx2.setup(frame.getChart());
        frame.setVisible(true);
    }
}