Example 1: Treemap
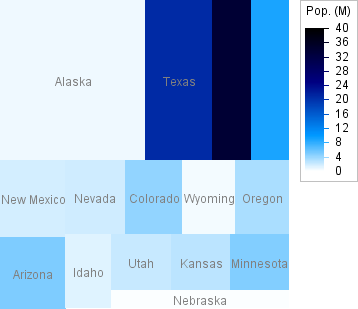
A treemap is constructed from area and population data of the 15 largest US states. Each rectangle is proportional to the state's area (in square miles) and is shaded by its population (in millions).
import com.imsl.chart.*;

public class TreemapEx1 extends javax.swing.JApplet {

    public void init() {
        Chart chart = new Chart(this);
        JPanelChart panel = new JPanelChart(chart);
        getContentPane().add(panel, java.awt.BorderLayout.CENTER);
        setup(chart);
    }

    static private void setup(Chart chart) {
        AxisXY axis = new AxisXY(chart);

        double[] areas = {
            570374, 261914, 155973, 145556, 121364,
            113642, 109806, 103729, 97105, 96002,
            82751, 82168, 81823, 79617, 76878
        };

        double[] population = {
            0.626932, 20.851820, 33.871648, 9.02195, 1.819046,
            5.130632, 1.998257, 4.301261, 0.493782, 3.421399,
            1.293953, 2.233169, 2.688418, 4.919479, 0.1711263
        };

        String[] names = {
            "Alaska", "Texas", "California", "Montana", "New Mexico",
            "Arizona", "Nevada", "Colorado", "Wyoming", "Oregon",
            "Idaho", "Utah", "Kansas", "Minnesota", "Nebraska"
        };

        Treemap treemap = new Treemap(axis, areas, population,
                Colormap.BLUE_WHITE);
        treemap.setZRange(new double[]{0, 40});
        treemap.setLabels(names);
        treemap.setTextColor(java.awt.Color.gray);
        treemap.getTreemapLegend().setPaint(true);
        treemap.getTreemapLegend().setTitle("Pop. (M)");
        treemap.getTreemapLegend().setTextFormat("0");
        axis.setViewport(0.05, 0.8, 0.1, 0.95);
    }

    public static void main(String argv[]) {
        JFrameChart frame = new JFrameChart();
        TreemapEx1.setup(frame.getChart());
        frame.setVisible(true);
    }
}
Output
Link to Java source.