Example: c-Chart
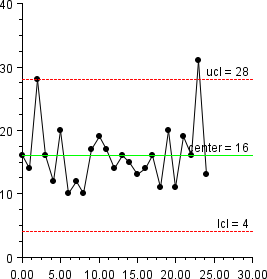
The number of defects on each of 25 successive wafers is plotted. The data is from NIST Engineering Statistics Handbook: Counts Control Charts
. This class can be used either as an applet or as an application.
import com.imsl.chart.*;
import com.imsl.chart.qc.CChart;

public class CChartEx1 extends javax.swing.JApplet {

    static private final int numberOfDefects[] = {
        16, 14, 28, 16, 12, 20, 10, 12, 10, 17, 19, 17, 14, 16, 15, 13,
        14, 16, 11, 20, 11, 19, 16, 31, 13
    };

    public void init() {
        Chart chart = new Chart(this);
        JPanelChart panel = new JPanelChart(chart);
        getContentPane().add(panel, java.awt.BorderLayout.CENTER);
        setup(chart);
    }

    static private void setup(Chart chart) {
        AxisXY axis = new AxisXY(chart);
        CChart control = new CChart(axis, numberOfDefects);
    }

    public static void main(String argv[]) {
        JFrameChart frame = new JFrameChart();
        CChartEx1.setup(frame.getChart());
        frame.setVisible(true);
    }
}
Output
Link to Java source.