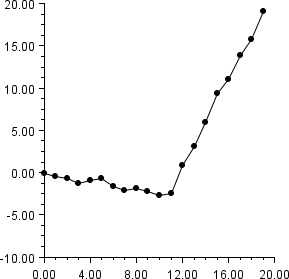
Example: CuSum Chart
A CuSum chart is constructed from the data at NIST Engineering Statistics Handbook: CuSum Control Charts
. This class can be used either as an applet or as an application.
import com.imsl.chart.*;
import com.imsl.chart.qc.CuSum;

public class CuSumEx1 extends javax.swing.JApplet {

    static private final double data[] = {
        324.925, 324.675, 324.725, 324.350, 325.350, 325.225, 324.125,
        324.525, 325.225, 324.600, 324.625, 325.150, 328.325, 327.250,
        327.825, 328.500, 326.675, 327.775, 326.875, 328.350
    };

    public void init() {
        Chart chart = new Chart(this);
        JPanelChart panel = new JPanelChart(chart);
        getContentPane().add(panel, java.awt.BorderLayout.CENTER);
        setup(chart);
    }

    private void setup(final Chart chart) {
        AxisXY axis = new AxisXY(chart);
        double mean = 325;
        CuSum cusum = new CuSum(axis, data);
        cusum.setExpectedMean(mean);
    }

    public static void main(String argv[]) {
        JFrameChart frame = new JFrameChart();
        new CuSumEx1().setup(frame.getChart());
        frame.setVisible(true);
    }
}
Output
Link to Java source.