Example: np-Chart
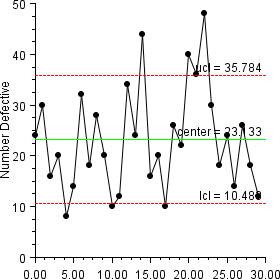
The location of 50 chips on each of 30 successive wafers is measured. The number of defects is the number of horizontal or vertical misregistrations of chips. The data is from NIST Engineering Statistics Handbook: Proportions Control Charts
. This class can be used either as an applet or as an application.
import com.imsl.chart.*;
import com.imsl.chart.qc.NpChart;

public class NpChartEx1 extends javax.swing.JApplet {

    static private final int numberDefective[] = {
        24, 30, 16, 20, 8, 14, 32, 18, 28, 20, 10, 12, 34,
        24, 44, 16, 20, 10, 26, 22, 40, 36, 48, 30, 18, 24,
        14, 26, 18, 12
    };
    static private final int sampleSize = 100;

    public void init() {
        Chart chart = new Chart(this);
        JPanelChart panel = new JPanelChart(chart);
        getContentPane().add(panel, java.awt.BorderLayout.CENTER);
        setup(chart);
    }

    static private void setup(Chart chart) {
        AxisXY axis = new AxisXY(chart);
        axis.getAxisY().getAxisTitle().setTitle("Number Defective");
        NpChart np = new NpChart(axis, sampleSize, numberDefective);
    }

    public static void main(String argv[]) {
        JFrameChart frame = new JFrameChart();
        NpChartEx1.setup(frame.getChart());
        frame.setVisible(true);
    }
}
Output
Link to Java source.