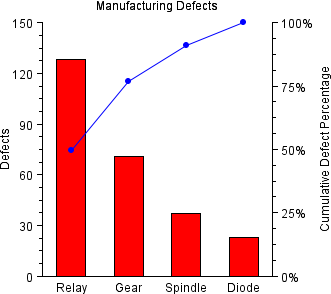
Example: Pareto Chart
The number of defects caused by four different factors were measured and plotted as a Pareto Chart. The class ParetoChart
sorts the factors in order of number of defects. This class can be used either as an applet or as an application.
import com.imsl.chart.*;
import com.imsl.chart.qc.ParetoChart;

public class ParetoEx1 extends javax.swing.JApplet {

    public void init() {
        Chart chart = new Chart(this);
        JPanelChart panel = new JPanelChart(chart);
        getContentPane().add(panel, java.awt.BorderLayout.CENTER);
        setup(chart);
    }

    static private void setup(Chart chart) {
        AxisXY axisBar = new AxisXY(chart);

        int numberDefects[] = {71, 23, 128, 37};
        String labels[] = {"Gear", "Diode", "Relay", "Spindle"};
        ParetoChart pareto = new ParetoChart(axisBar, labels, numberDefects);
        pareto.setFillColor(java.awt.Color.red);
        pareto.addCumulativeLine();
        Data cumulativeLine = pareto.getCumulativeLine();
        cumulativeLine.setMarkerType(Data.MARKER_TYPE_FILLED_CIRCLE);
        cumulativeLine.setLineColor(java.awt.Color.blue);
        cumulativeLine.setMarkerColor(java.awt.Color.blue);

        chart.getChartTitle().setTitle("Manufacturing Defects");
        axisBar.getAxisY().getAxisTitle().setTitle("Defects");
        pareto.getCumulativeAxis().getAxisY().getAxisTitle().
                setTitle("Cumulative Defect Percentage");
    }

    public static void main(String argv[]) {
        JFrameChart frame = new JFrameChart();
        ParetoEx1.setup(frame.getChart());
        frame.setVisible(true);
    }
}
Output
Link to Java source.