Example: XbarR Chart
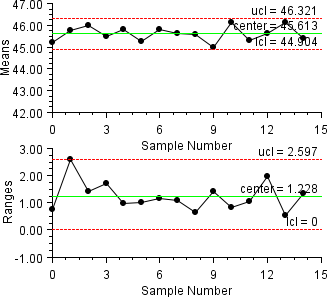
During a manufacturing process 15 samples, each containing 5 items, were measured. An XbarR chart was contructed from the 15 sample ranges. This class can be used either as an applet or as an application.
import com.imsl.chart.*;
import com.imsl.chart.qc.*;

public class XbarREx1 extends javax.swing.JApplet {

    static private final double data[][] = {
        {44.73, 45.47, 45.39, 45.33, 45.24},
        {45.57, 46.87, 45.40, 46.68, 44.29},
        {46.39, 45.31, 46.74, 46.06, 45.51},
        {45.54, 46.27, 44.57, 45.36, 45.72},
        {45.58, 45.59, 46.02, 45.45, 46.42},
        {45.91, 45.38, 44.98, 44.91, 45.17},
        {45.98, 45.29, 45.50, 45.77, 46.44},
        {46.30, 45.65, 45.21, 45.43, 45.57},
        {45.77, 45.38, 45.65, 45.25, 45.89},
        {44.10, 45.44, 45.27, 45.53, 44.65},
        {45.95, 46.22, 46.71, 45.92, 45.90},
        {44.87, 44.98, 45.91, 45.18, 45.64},
        {44.70, 45.89, 46.67, 45.84, 45.07},
        {45.90, 45.80, 46.30, 46.34, 46.34},
        {44.90, 46.23, 45.31, 45.29, 45.16}
    };

    public void init() {
        Chart chart = new Chart(this);
        JPanelChart panel = new JPanelChart(chart);
        getContentPane().add(panel, java.awt.BorderLayout.CENTER);
        setup(chart);
    }

    static private void setup(Chart chart) {
        ShewhartControlChart control[] = XbarR.createCharts(chart, data);
    }

    public static void main(String argv[]) {
        JFrameChart frame = new JFrameChart();
        XbarREx1.setup(frame.getChart());
        frame.setVisible(true);
    }
}
Output
Link to Java source.