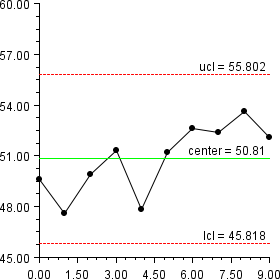
Example: Moving Range Chart
This moving range chart plots the flowrate for 10 batches. The data is from NIST Engineering Statistics Handbook: Individuals Control Charts
. This class can be used either as an applet or as an application.
import com.imsl.chart.*;
import com.imsl.chart.qc.XmR;

public class XmREx1 extends javax.swing.JApplet {

    static private final double flowrate[] = {
        49.6, 47.6, 49.9, 51.3, 47.8, 51.2, 52.6, 52.4, 53.6, 52.1
    };

    public void init() {
        Chart chart = new Chart(this);
        JPanelChart panel = new JPanelChart(chart);
        getContentPane().add(panel, java.awt.BorderLayout.CENTER);
        setup(chart);
    }

    static private void setup(Chart chart) {
        AxisXY axis = new AxisXY(chart);
        XmR mr = new XmR(axis, flowrate);
    }

    public static void main(String argv[]) {
        JFrameChart frame = new JFrameChart();
        XmREx1.setup(frame.getChart());
        frame.setVisible(true);
    }
}
Output
Link to Java source.