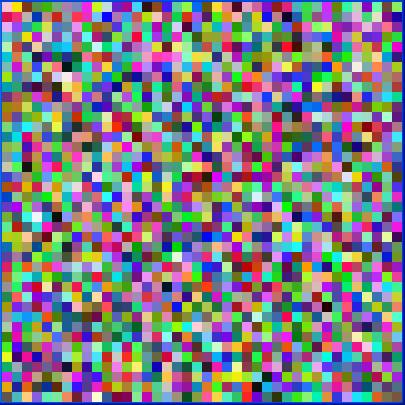
This example creates a Kohonen network with 40 x 40 nodes. Each node has 3 weights, representing the RGB values of a color. This network is trained with 8 colors using 500 iterations. Then, the example prints out a forecast result.
Initially, the image of the nodes is:
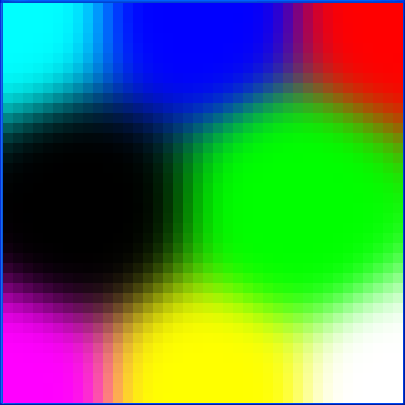
After the training, the image is:
import com.imsl.datamining.*;
import com.imsl.stat.*;

public class KohonenSOMEx1 extends KohonenSOMTrainer {

    private static int totalIter = 500, nrow = 40, ncol = 40;
    private double initialLearning = 0.07;

    public double getNeighborhoodValue(int t, double d) {
        double factor, c;

        // A Gaussian function.
        factor = Math.max(nrow, ncol) / 4.0;
        c = (double) (totalIter - t) / ((double) totalIter / factor);

        return Math.exp(-(d * d) / (2.0 * c * c));
    }

    public double getLearningCoefficient(int t) {
        return initialLearning * Math.exp(-(double) t / (double) totalIter);
    }

    public static void main(String args[]) {
        double[][] data = {
            {1.0, 0.0, 0.0},
            {0.0, 1.0, 0.0},
            {0.0, 0.0, 1.0},
            {1.0, 1.0, 0.0},
            {1.0, 0.0, 1.0},
            {0.0, 1.0, 1.0},
            {0.0, 0.0, 0.0},
            {1.0, 1.0, 1.0}
        };

        // Use a Random object to set the weights.
        Random rand = new Random(123457);
        rand.setMultiplier(16807);

        // Train the Kohonen network.
        KohonenSOM kohonen = new KohonenSOM(3, nrow, ncol);
        kohonen.setWeights(rand);

        KohonenSOMEx1 trainer = new KohonenSOMEx1();
        trainer.setIterations(totalIter);
        trainer.train(kohonen, data);

        // Get a forecast after training.
        double[] fdata = {0.25, 0.50, 0.75};
        int[] indices = kohonen.forecast(fdata);

        System.out.printf("The input (%.2f, %.2f, %.2f) has forecasted "
                + "output (%d, %d) \nwhich corresponds to the pink area on "
                + "the estimated map.\n", fdata[0], fdata[1], fdata[2],
                indices[0], indices[1]);
    }
}
The input (0.25, 0.50, 0.75) has forecasted output (7, 9)
which corresponds to the pink area on the estimated map.
Link to Java source.