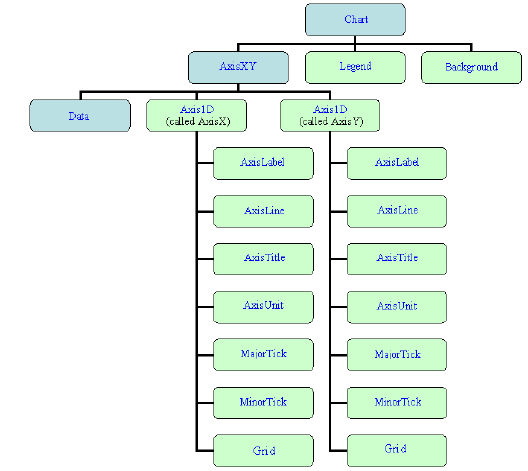
Implicitly Created Nodes
Some chart nodes automatically create additional nodes, as their children, when they are created. These nodes can be accessed via get methods. For example, the code
chart.getBackground().setFillColor(java.awt.Color.green);
changes the background color. The method
getBackground retrieves the
Background node from the chart object and the method
setFillColor sets the
Background object’s
FillColor attribute to
Color.green.
In the following diagram, the nodes automatically created are shown in light green (to view in color see the online documentation).
Method calls can be chained together. For example, the following sets the thickness of the major tick marks on the x-axis.
axis.getAxisX().getMajorTick().setLineWidth(2.0);
where
axis is an
AxisXY object.
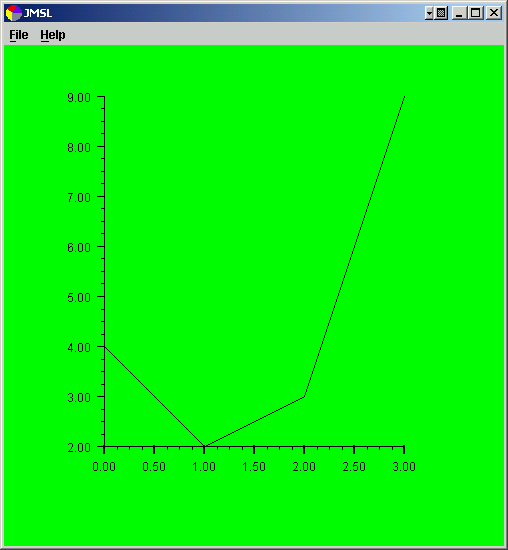
A customized version of the above chart can be obtained by changing its constructor as in the following.
import com.imsl.chart.*;
public class Intro2 extends JFrameChart {
public Intro2() {
Chart chart = getChart();
AxisXY axis = new AxisXY(chart);
double y[] = {4, 2, 3, 9};
new Data(axis, y);
chart.getBackground().setFillColor(java.awt.Color.green);
axis.getAxisX().getMajorTick().setLineWidth(2.0);
}
public static void main(String argv[]) {
new Intro2().setVisible(true);
}
}