Bar Chart
The class
Bar is used to create bar charts and histograms. This pagesection describes the construction of labeled bar charts. For a discussion of histograms, see
Histogram.
Simple Bar Chart
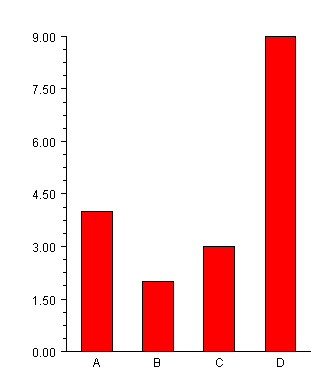
The following code creates this labeled bar chart. The
BarType attribute can be either
BAR_TYPE_VERTICAL or
BAR_TYPE_HORIZONTAL. The method
setLabels sets the bar labels and adjusts the attributes of the axis to be appropriate for bar labels. The
setLabels method must be called after the
setBarType method, so that the correct axis has its attributes adjusted.
The drawing of the bars is controlled by the
FillType and
FillOutlineType attributes. By default
FillType has the value
FILL_TYPE_SOLID, so setting the associated attribute
FillColor to red causes solid red bars to be drawn.
import com.imsl.chart.*;
import java.awt.Color;
public class SampleBar extends JFrameChart {
public SampleBar() {
Chart chart = getChart();
AxisXY axis = new AxisXY(chart);
double y[] = {4, 2, 3, 9};
Bar bar = new Bar(axis, y);
bar.setBarType(Bar.BAR_TYPE_VERTICAL);
bar.setLabels(new String[]{"A","B","C","D"});
bar.setFillColor(Color.red);
}
public static void main(String argv[]) {
new SampleBar().setVisible(true);
}
}
Attribute BarGap
The BarGap attribute sets the gap between bars in a group. A gap of 1.0 means that space between bars is the same as the width of an individual bar in the group. Its default value is 0.0, meaning there is no space between groups.
Attribute BarWidth
The BarWidth attribute sets the width of the groups of bars at each index. Its default value is 0.5. If the number of groups is increased, the width of each individual bar is reduced proportionately.
See
Histogram for an example of the use of the
BarWidth attribute.