Line Plot
A line plot consists of points connected by lines. The lines can be formatted using the
Line Attributes.
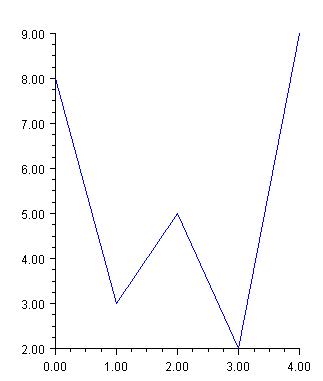
Simple Line Plot
This example shows a simple line plot. The
Data node is created using an array of
y-values. The
x-values default to 0, 1, …. The
DataType attribute is set to
DATA_TYPE_LINE to make this a line chart. The look of the line is controlled by the line attributes. Here the
LineColor attribute is set to blue.
import com.imsl.chart.*;
import java.awt.Color;
public class SampleSimpleLine extends JFrameChart {
public SampleSimpleLine() {
Chart chart = getChart();
AxisXY axis = new AxisXY(chart);
double y[] = {8, 3, 5, 2, 9};
Data data1 = new Data(axis, y);
data1.setDataType(Data.DATA_TYPE_LINE);
data1.setLineColor(Color.blue);
}
public static void main(String argv[]) {
new SampleSimpleLine().setVisible(true);
}
}
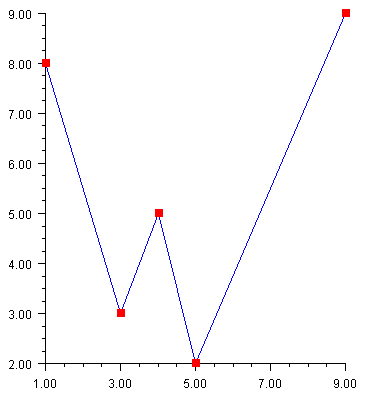
Mixed Line and Marker Plot
The
DataType attribute can be set using “or” syntax to combine types. In this example, it is set to
DATA_TYPE_LINE ∣ DATA_TYPE_MARKER. This example also explicitly sets both the
x-value and the
y-value of the data points. Note that the
x-values do not have to be uniformly spaced.
import com.imsl.chart.*;
public class SampleLineMarker extends JFrameChart {
public SampleLineMarker() {
Chart chart = getChart();
AxisXY axis = new AxisXY(chart);
double x[] = {1, 3, 4, 5, 9};
double y[] = {8, 3, 5, 2, 9};
Data data = new Data(axis, x, y);
data.setDataType(Data.DATA_TYPE_LINE | Data.DATA_TYPE_MARKER);
data.setLineColor(java.awt.Color.blue);
data.setMarkerColor(java.awt.Color.red);
data.setMarkerType(Data.MARKER_TYPE_FILLED_SQUARE);
}
public static void main(String argv[]) {
new SampleLineMarker().setVisible(true);
}
}