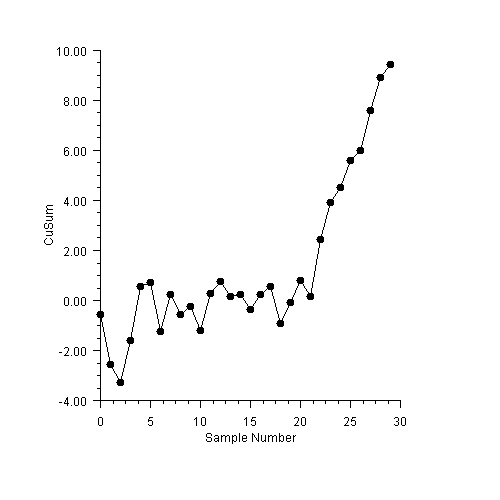
CuSum is the cumulative sum control chart. It plots the cumulative sum of the deviations of the expected value. If μ0 is the expected mean for a process and are the sample means then the cumulative sum is
CuSum Example
The data used is the same as for the EWMA example.