JMSL Chart Programmer’s Guide
CuSumStatus
CuSumStatus is a tabular or status CuSum chart. The tabular CuSum statistics are
By default, both statistics have initial value zero. The parameter K is the slack value (or allowance or reference value) and μ0 is the expected mean.
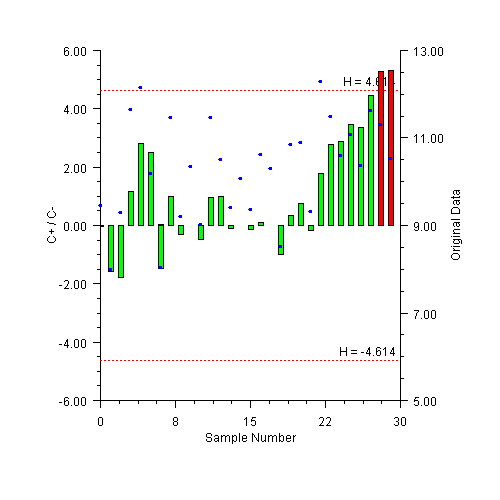
The CuSumStatus chart contains two bar charts: a bar chart of above the x-axis and a bar chart of below the x-axis. There are also control limits at plus and minus H. The value of H can be set either as an absolute value or as a relative value h. They are related by H = hσ, where σ is the standard deviation. By default, bars which are out-of-control are filled red while in-control bars are green. The data is also plotted on the chart.
The CuSumStatus has a print method to print the and values as well as and , where is the number of consecutive periods since rose above zero.
CuSumStatus Example
This example uses the same data as used for the CuSum and EWMA examples. In this example H = 4σ.
View code file
 
import com.imsl.chart.*;
import com.imsl.chart.qc.*;
 
public class SampleCuSumStatus extends JFrameChart {
 
public SampleCuSumStatus() {
double expectedMean = 10;
double slackValue = 0.5;
 
Chart chart = getChart();
AxisXY axis = new AxisXY(chart);
CuSumStatus cusumStatus = new CuSumStatus(axis,
SampleEWMA.data, expectedMean, slackValue);
cusumStatus.setRelativeH(4);
cusumStatus.print();
 
axis.getAxisX().getAxisTitle().setTitle("Sample Number");
axis.getAxisX().getAxisLabel().setTextFormat("0");
axis.getAxisY().getAxisTitle().setTitle("C+ / C-");
 
axis.getAxisX().setWindow(0, 30);
axis.getAxisX().setAutoscaleInput(0);
 
cusumStatus.addDataMarkers();
cusumStatus.getDataMarkers().setMarkerSize(0.5);
cusumStatus.getDataMarkers().setMarkerColor(java.awt.Color.blue);
Axis1D axisY = cusumStatus.getDataMarkersAxis().getAxisY();
axisY.getAxisTitle().setTitle("Original Data");
}
 
public static void main(String argv[]) {
new SampleCuSumStatus().setVisible(true);
}
}