ShewhartControlChart and ControlLimit
The
ShewhartControlChart class is primarily used as the base class of other control chart classes. It provides the common functionality for the control charts.
For example, the default JMSL control charts include a center line and an upper and lower control limit at plus or minus three standard deviations from the center line. The Western Electric Company Rules (or WECO) are control limits at plus or minus one, two, and three standard deviations from the mean. They can be added using the method
addWecoLimits in the
ShewhartControlChart class.
The
ShewhartControlChart uses the
ControlLimit class for the upper and lower control limits and for the center line. Additional control limits, such as the WECO limits, can be added to a
ShewhartControlChart. The line attributes can be used with
ControlLimit to modify the drawing of each control limit.
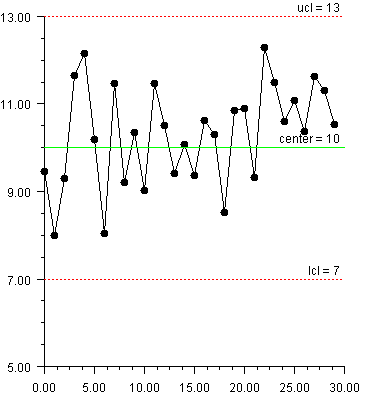
The ShewhartControlChart class can be used directly when the statistics are computed by the user. In this example, data from Montgomery, Douglas C., Introduction to Statistical Quality Control, 4th Ed., 2001, New York: John Wiley and Sons, p. 406 is plotted. The code explicitly sets the lower control limit to 7 and the upper control limit to 13.
Further citations throughout this chapter for data plotted from Montgomery appear as parenthetical citations, e.g. (Montgomery 406).
Control Limit Customization
Control Limits and center lines can be added using the
ControlLimit.setValue methods;
addCenterLine().setValue(int) (see
addCenterLine()),
addUpperControlLimit().setValue(int) (see
addUpperControlLimit()) and
addLowerControlLimit().
setValue(int) (see
addLowerControlLimit()). It is foreseeable that the default appearance might not be optimal for every application. In particular moving components or removing the
ControlLimit objects can accomplished.
Before modifying a
ControlLimit title it is important to realize the
ControlLimit title text is justified in the lower right corner of a
Text object (
TEXT_X_RIGHT ∣ TEXT_Y_BOTTOM). With this in mind, formatted strings may be used to alter their appearance. For example, to retain the
ControlLimit line but eliminate the title, get the
ControlLimit and
set the title to an empty string (i.e.
getUpperControlLimit().setTitle("");). In addition, the following can be used to move the title closer to the
y-axis (note that repeated, leading, and trailing new lines
"\n" are ignored):
Formatter fmt = new Formatter();
xbars.getUpperControlLimit().setTitle(fmt.format("ucl=15%90s",
" ").toString());
After being added, it may be the case that a
ControlLimit should be removed. This is accomplished with the
AbstractChartNode remove() method. In the case of an upper control limit this would be
AbstractChartNode.remove().
import com.imsl.chart.*;
import com.imsl.chart.qc.*;
public class SampleShewhart extends JFrameChart {
static final double data[] = {
9.45, 7.99, 9.29, 11.66, 12.16, 10.18,
8.04, 11.46, 9.20, 10.34, 9.03, 11.47,
10.51, 9.40, 10.08, 9.37, 10.62, 10.31,
8.52, 10.84, 10.90, 9.33, 12.29, 11.50,
10.60, 11.08, 10.38, 11.62, 11.31, 10.52
};
public SampleShewhart() {
Chart chart = getChart();
AxisXY axis = new AxisXY(chart);
ShewhartControlChart xbars = new ShewhartControlChart(axis);
xbars.setData(data);
xbars.addLowerControlLimit().setValue(7);
xbars.addCenterLine().setValue(10);
xbars.addUpperControlLimit().setValue(13);
}
public static void main(String argv[]) {
new SampleShewhart().setVisible(true);
}
}