XmR is a moving range chart. It is used when only samples of size one are available. The moving range statistic is
The control limits are computed using
Where is the mean of the observations, is the mean of the moving ranges and d2,n is the mean of the distribution of the ranges of n samples from the normal distribution with mean of zero and standard deviation of one.
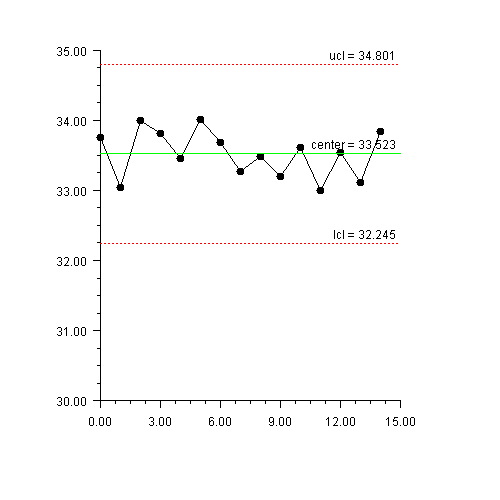
XmR Example
The viscosity of aircraft primer paint was measured. Since the paint is produced in batches, only single samples are available (Montgomery 251).