Labels
Labels annotate data points or pie slices. As a degenerate case they can be used to place text on a chart without drawing a point. Labels are controlled by the value of the attribute
LabelType in a
Data node.
Multiline labels are allowed. They are created by newline characters in the string that creates the label.
Attribute LabelType
The attribute LabelType takes on one of the following values:
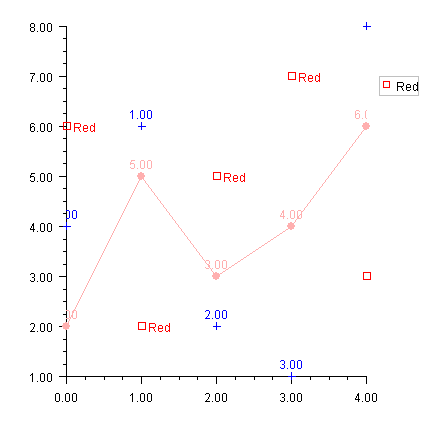
Data Point Labeling Example
This example shows three data sets, each labeled in a different fashion.
The first data set is blue and the points are labeled by the value of their x-coordinates.
The second data set is pink and the points are labeled by the value of their y-coordinates. The data set is drawn with both markers and lines.
The third data set is red and the points are labeled with the
Data node’s
Title attribute.
import com.imsl.chart.*;
import java.awt.Color;
public class SampleLabels extends JFrameChart {
public SampleLabels() {
Chart chart = getChart();
AxisXY axis = new AxisXY(chart);
chart.getLegend().setPaint(true);
// Data set 1 - labeled with X
double y1[] = {4, 6, 2, 1, 8};
Data data1 = new Data(axis, y1);
data1.setDataType(Data.DATA_TYPE_MARKER);
data1.setMarkerColor(Color.blue);
data1.setTextColor(Color.blue);
data1.setLabelType(Data.LABEL_TYPE_X);
// Data set 2 - labeled with Y
double y2[] = {2, 5, 3, 4, 6};
Data data2 = new Data(axis, y2);
data2.setDataType(Data.DATA_TYPE_MARKER | Data.DATA_TYPE_LINE);
data2.setMarkerColor(Color.pink);
data2.setMarkerType(Data.MARKER_TYPE_FILLED_CIRCLE);
data2.setLineColor(Color.pink);
data2.setTextColor(Color.pink);
data2.setLabelType(Data.LABEL_TYPE_Y);
// Data set 3 - labeled with Title
double y3[] = {6, 2, 5, 7, 3};
Data data3 = new Data(axis, y3);
data3.setDataType(Data.DATA_TYPE_MARKER);
data3.setMarkerColor(Color.red);
data3.setMarkerType(Data.MARKER_TYPE_HOLLOW_SQUARE);
data3.setLineColor(Color.red);
data3.setTextColor(Color.red);
data3.setLabelType(Data.LABEL_TYPE_TITLE);
data3.setTitle("Red");
data3.getTitle().setAlignment(
Data.TEXT_X_LEFT | Data.TEXT_Y_CENTER);
}
public static void main(String argv[]) {
new SampleLabels().setVisible(true);
}
}
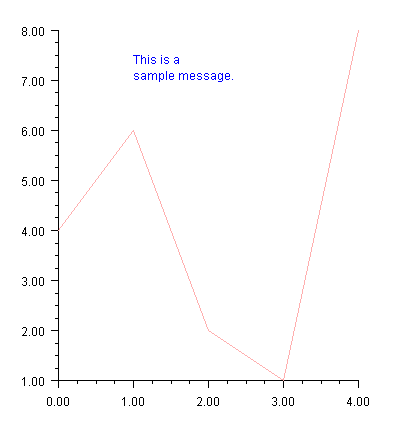
Annotation
The Annotation class can be used to place text on a chart. In this example a text message is drawn at (1,7) as its bottom left corner.
Note that it is a two line message. New lines in the string are reflected in the chart.
The text alignment is set to
TEXT_X_LEFT ∣ TEXT_Y_BOTTOM, so (1,7) is the lower left corner of the text’s bounding box (see the section
Attribute Title).
import com.imsl.chart.*;
import java.awt.Color;
public class SampleLabelMessage extends JFrameChart {
public SampleLabelMessage() {
Chart chart = getChart();
AxisXY axis = new AxisXY(chart);
double y[] = {4, 6, 2, 1, 8};
Data data = new Data(axis, y);
data.setDataType(Data.DATA_TYPE_LINE);
data.setLineColor(Color.pink);
Text message = new Text("This is a\nsample message.");
message.setAlignment(Data.TEXT_X_LEFT | Data.TEXT_Y_BOTTOM);
Annotation messageAnnotation =
new Annotation(axis, message, 1.0, 7.0);
messageAnnotation.setTextColor(Color.blue);
}
public static void main(String argv[]) {
new SampleLabelMessage().setVisible(true);
}
}