Legend
The legend is used to identify data sets.
Data nodes that have their
Title attribute defined are automatically included in the legend box.
The
Legend node is automatically created by the
Chart node as its child. By default, the legend is not drawn because its
Paint attribute is set to
false.
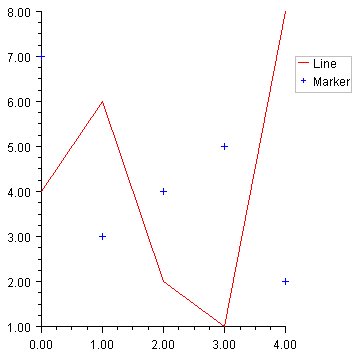
Simple Legend Example
At a minimum, adding a legend to a chart requires setting the legend’s Paint attribute to true and setting the Title attribute in the Data nodes that are to appear in the legend box. This example shows such a minimal legend.
import com.imsl.chart.*;
import java.awt.Color;
public class SampleSimpleLegend extends JFrameChart {
public SampleSimpleLegend() {
Chart chart = getChart();
AxisXY axis = new AxisXY(chart);
chart.getLegend().setPaint(true);
double y1[] = {4, 6, 2, 1, 8};
Data data1 = new Data(axis, y1);
data1.setDataType(Data.DATA_TYPE_LINE);
data1.setLineColor(Color.red);
data1.setTitle("Line");
double y2[] = {7, 3, 4, 5, 2};
Data data2 = new Data(axis, y2);
data2.setDataType(Data.DATA_TYPE_MARKER);
data2.setMarkerColor(Color.blue);
data2.setTitle("Marker");
}
public static void main(String argv[]) {
new SampleSimpleLegend().setVisible(true);
}
}
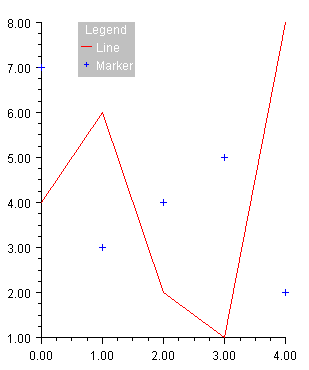
Legend Example
This example shows more of the attributes that affect a legend. If the legend’s Title attribute is set, then it is used as a header in the legend box.
The text properties for all of the text strings in the legend box are obtained from the
Legend node, not from the associated
Data nodes (see the section
Text Attributes). Here the
TextColor is set to white.
The background of the legend box can be set by changing the fill attributes (see the section
Fill Area Attributes). By default in the
Legend node,
FillType is set to
FILL_TYPE_NONE and
FillColor is set to
Color.lightGray.
The position of the legend box is controlled by its
Viewport attribute. The viewport is the region of the
Component, in which the chart is being drawn, that the legend box occupies. The upper left corner is (0,0) and the lower right corner is (1,1). The default value of the legend viewport is [0.83, 0.0] by [0.2, 0.2]. The position of the legend can be controlled by the
xmin and
ymin parameters of method
setViewport (note that the
xmax and
ymax parameters do not affect the legend viewport).
import com.imsl.chart.*;
import java.awt.Color;
public class SampleLegend extends JFrameChart {
public SampleLegend() {
Chart chart = getChart();
AxisXY axis = new AxisXY(chart);
Legend legend = chart.getLegend();
legend.setPaint(true);
legend.setTitle("Legend");
legend.setTextColor(Color.white);
legend.setFillType(legend.FILL_TYPE_SOLID);
legend.setViewport(0.3, 0.4, 0.1, 0.4);
double y1[] = {4, 6, 2, 1, 8};
Data data1 = new Data(axis, y1);
data1.setDataType(Data.DATA_TYPE_LINE);
data1.setLineColor(Color.red);
data1.setTitle("Line");
double y2[] = {7, 3, 4, 5, 2};
Data data2 = new Data(axis, y2);
data2.setDataType(Data.DATA_TYPE_MARKER);
data2.setMarkerColor(Color.blue);
data2.setTitle("Marker");
}
public static void main(String argv[]) {
new SampleLegend().setVisible(true);
}
}