Multiple Axes
A JMSL chart can contain any number of axes. Each axis has its own mapping from the user coordinates to the device (screen) coordinates.
Normally, the x‑axis is at the bottom of the chart and the y‑axis is to the left. The attribute Type can be changed to move the x‑axis to the top of the chart and/or the y‑axis to the right of the chart.
Axis can be moved from the chart edge, either away from the chart or into the middle of the chart data area, by setting the attribute Cross.
Attribute Type
The attribute
Type specifies the position of an
x or
y‑axis. Applied to the
x‑axis it can have the values
AXIS_X (the default) or
AXIS_X_TOP. Applied to the
y‑axis, it can have the value
AXIS_Y (the default) or
AXIS_Y_RIGHT.
Attribute Cross
The Cross attribute specifies the coordinates of intersection of the x‑axis and y‑axis. This can be inside or outside of the chart body. Cross can be used to place multiple y‑axes to the left of the chart or multiple x‑axes below the chart.
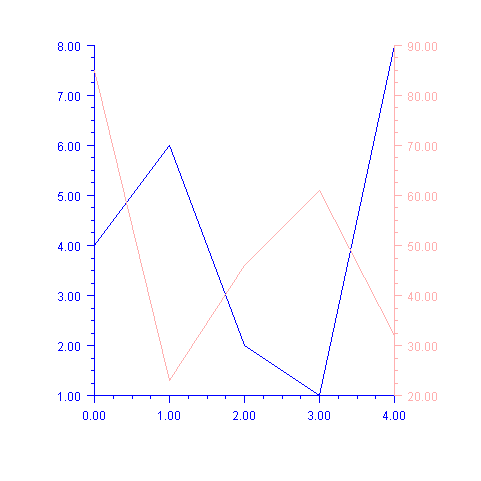
Example
Two data sets are plotted, each on its own axis. The first (blue) axis is left in the default position with the y‑axis on the left. The second (pink) axis has its y‑axis moved to the right.
In this example the
x‑axis is shared between the two axes, so it is not painted as part of the second (pink) axis. This is done by setting its
Paint attribute to
false (see
setPaint).
import com.imsl.chart.*;
import java.awt.Color;
public class SampleAxesLeftRight extends JFrameChart {
public SampleAxesLeftRight() {
Chart chart = getChart();
AxisXY axisLeft = new AxisXY(chart);
double yLeft[] = {4, 6, 2, 1, 8};
Data dataLeft = new Data(axisLeft, yLeft);
dataLeft.setDataType(Data.DATA_TYPE_LINE);
axisLeft.setLineColor(Color.blue);
axisLeft.setTextColor(Color.blue);
AxisXY axisRight = new AxisXY(chart);
axisRight.getAxisX().setPaint(false);
axisRight.getAxisY().setType(Axis1D.AXIS_Y_RIGHT);
double yRight[] = {85, 23, 46, 61, 32};
Data dataRight = new Data(axisRight, yRight);
dataRight.setDataType(Data.DATA_TYPE_LINE);
axisRight.setLineColor(Color.pink);
axisRight.setTextColor(Color.pink);
}
public static void main(String argv[]) {
new SampleAxesLeftRight().setVisible(true);
}
}
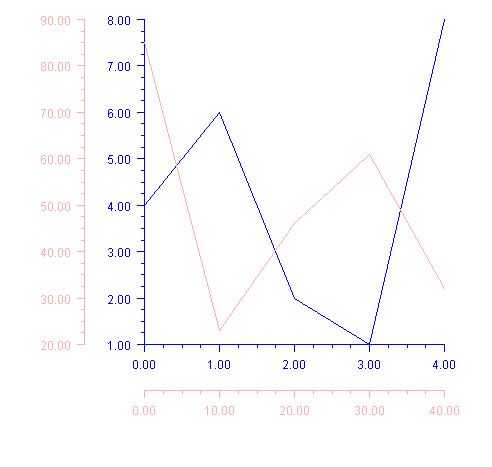
Cross Example
Multiple x and y-axes are shown.
The Cross attribute is used to specify that the second (pink) axes intersect at (-8,10), in the pink-axis coordinate system.
The
Viewport attribute is changed in both sets of axes to shrink the size of the chart body and leave more room to the left and below the chart for the pink axes.
import com.imsl.chart.*;
import java.awt.Color;
public class SampleAxesCross extends JFrameChart {
public SampleAxesCross() {
Chart chart = getChart();
AxisXY axisLeft = new AxisXY(chart);
double yLeft[] = {4, 6, 2, 1, 8};
Data dataLeft = new Data(axisLeft, yLeft);
dataLeft.setDataType(Data.DATA_TYPE_LINE);
axisLeft.setLineColor(Color.blue);
axisLeft.setTextColor(Color.blue);
AxisXY axisRight = new AxisXY(chart);
axisRight.setCross(-8,10);
double xRight[] = {0, 10, 20, 30, 40};
double yRight[] = {85, 23, 46, 61, 32};
Data dataRight = new Data(axisRight, xRight, yRight);
dataRight.setDataType(Data.DATA_TYPE_LINE);
axisRight.setLineColor(Color.pink);
axisRight.setTextColor(Color.pink);
double viewport[] = {0.3, 0.9, 0.05, 0.7};
axisLeft.setViewport(viewport);
axisRight.setViewport(viewport);
}
public static void main(String argv[]) {
new SampleAxesCross().setVisible(true);
}
}