Chart XML Syntax
The Chart XML syntax is defined by a document type definition (DTD) file at
http://www.roguewave.com/products/jmsl/Chart.dtd.
Valid XML files begin with a prolog that contains the XML declaration and the document type declaration. For example:
<?xml version="1.0" encoding="UTF-8" standalone="no" ?>
<!DOCTYPE Chart PUBLIC "-//Rogue Wave Software//DTD JMSL Chart//EN"
"http://www.roguewave.com/products/jmsl/Chart.dtd">
Following the prolog is the body of the chart XML file. This is a tree of tags, with the <Chart> tag at the root. These tags mirror a JMSL chart tree. The following outline shows the hierarchy of tags.
<Chart >
<Array> | <Array id=name>
<Background>
<ChartTitle>
<Legend>
<AxisXY>
<AxisX> | <AxisY>
<AxisTitle>
<AxisLabel>
<AxisLine>
<AxisUnit>
<Grid>
<MajorTick>
<MinorTick>
<Data x=array y=array> | <Data y=array> | <Data>
<Bar x=array y=array> | <Bar y=array>
<BarSet> | <BarSet index=int>
<BarItem> | <BarItem index=int>
<ErrorBar x=array y=array low=array high=array>
<HighLowClose start=array high=array low=array close=array>
<HighLowClose high=array low=array close=array>
<Polar>
<Pie y=array>
<PieSlice> | <PieSlice index=int>
< Contour xGrid=array yGrid=array zData=array>
< Heatmap xmin=double xmax=double ymin=double y max=double
zmin=double zmax=double data=array colormap=name>
Some of the tags have array-valued arguments. These are either a list of doubles of the form "{1.2,3.4,5}" or "#id", where id is an <Array> tag id.
Each of the chart tags can also have any number of <Attribute> tags as children. They can have either of two forms:
<Attribute name="attribute-name" value="attribute-value"/>
or
<Attribute name="attribute-name">attribute-value</ Attribute>
Also, while not shown in the above list, each chart node can have a
<ToolTip> node as a child.
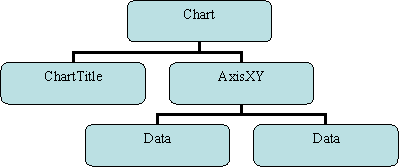
Syntax Example
The chart tree is created from the following XML file.
<?xml version="1.0" encoding="UTF-8" standalone="no" ?>
<!DOCTYPE Chart PUBLIC "-//Rogue Wave Software//DTD JMSL Chart//EN"
"http://www.roguewave.com/products/jmsl/Chart.dtd">
<Chart>
<ChartTitle>
<Attribute name="Title">Line Chart</Attribute>
<Attribute name="FontSize" value="14"/>
<Attribute name="FontStyle" value="3"/>
</ChartTitle>
<AxisXY>
<Data y="{6,5,7,1}">
<Attribute name="LineColor" value="blue"/>
<Attribute name="LineWidth" value="2.0"/>
<Attribute name="DataType"
value="DATA_TYPE_LINE|DATA_TYPE_MARKER"/>
<Attribute name="MarkerType" value="MARKER_TYPE_HOLLOW_SQUARE"/>
<Attribute name="Title" value="Blue Line"/>
<ToolTip/>
</Data>
<Data y="{1,3,6,8}">
<Attribute name="MarkerColor" value="darkblue"/>
<Attribute name="DataType" value="DATA_TYPE_MARKER"/>
<Attribute name="MarkerType" value="MARKER_TYPE_FILLED_CIRCLE"/>
<Attribute name="Title" value="Markers"/>
<ToolTip/>
</Data>
</AxisXY>
</Chart>
In the
ChartTitle node there are three attributes defined:
Title,
FontSize and
FontStyle. The argument "
y ={6,5,7,1}" in the
Data node is used to create an array passed to the
Data constructor.
Note that the attribute name must be specified using "name=", but that the attribute’s value can be either the value of a "value=" or the body of the attribute tag.