Chapter 7 Introduction to Chart 3D
Java 3D
The JMSL 3D chart package is built on top of Java 3D, an open source Java package which renders accelerated 3D graphics using OpenGL or Direct3D.
Java 3D Parent project is at
https://java3d.java.net/.
Knowledge of Java3D is not required to use the 3D chart package, but Java 3D must be installed to run a chart 3D application.
Overview
The JMSL 3D chart package can be used to create customizable 3D charts using Java and Java3D. Knowledge of Java3D is not required.
The JMSL 3D chart package is similar to the JMSL 2D chart package. In both, a chart is created by assembling chart nodes into a tree. This chart tree is then rendered to the screen.
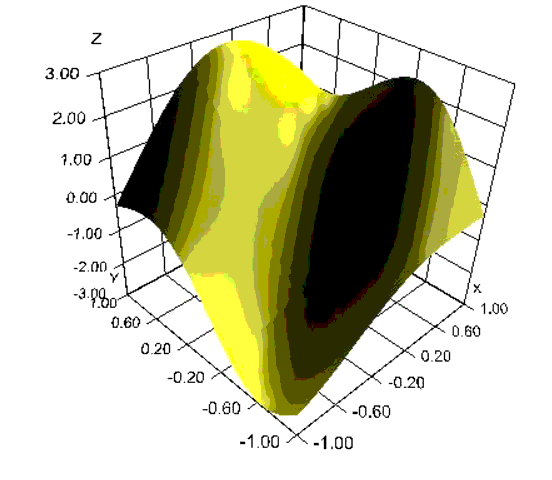
The following class is a simple example of the use of the 3D chart package. It plots the function
z = 2sin(x + y) - cos(2x - 3y)
over the square [-1,1] by [-1,1]. The chart is displayed in a Swing frame.
The class for this example extends the
JFrameChart3d class which creates the root
Chart3D node. A tree of chart nodes is then created starting from the
Chart3D root node,
ChartNode3D. After the tree is created, the render method is used to generate a Java 3D scene graph from the chart node tree. The scene graph is used to generate the image on the screen.
import com.imsl.chart3d.*;
public class SimpleSurface extends JFrameChart3D
implements Surface.ZFunction {
public SimpleSurface() {
Chart3D chart = getChart3D();
AxisXYZ axis = new AxisXYZ(chart);
Surface surface =
new Surface(axis, this, -1.0, 1.0, -1.0, 1.0);
surface.setFillColor(java.awt.Color.yellow);
surface.setSurfaceType(Surface.SURFACE_TYPE_NICEST);
render();
}
public double f(double x, double y) {
return 2*Math.sin(x+y) - Math.cos(2*x-3*y);
}
public static void main(String args[]) {
new SimpleSurface().setVisible(true);
}
}
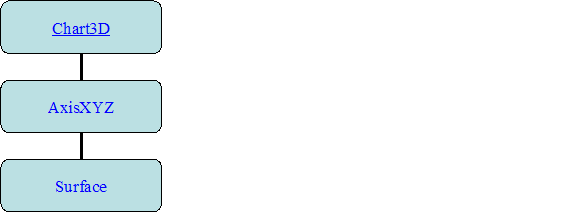
The above example created and assembled three nodes into the following tree:
The general pattern of the
AbstractChartNode class and derived classes have constructors whose first argument is the parent
AbstractChartNode of the
AbstractChartNode being created. The root node of the tree is always a
Chart3D object.
3D
Chart nodes can contain attributes, such as
FillColor and
LineWidth. Attributes are inherited via the chart tree. For example, when a
Surface node is being painted, its
FillColor attribute determines the color of the surface. If this attribute is set in the node being drawn, that is the value used. If it is not set, then its parent node (an
AxisXYZ node in the above example) is queried. If the attribute is not set in the parent node, then its parent is queried. This continues until the root node is reached, after which a default value is used. Note that this inheritance is not the same as Java class inheritance.
Attributes are set using setter methods, such as
setFillColor(Color) and retrieved using getter methods, such as
getFillColor().
Chart Movements
The mouse can be used to rotate, translate, or zoom a 3D chart.
Rotate
The chart is rotated when the mouse is moved with the main mouse button pressed. The rotation is in the direction of the mouse movement, with a rotation of 0.01 radians for each pixel of mouse movement.
Translate
The chart is translated when the mouse is moved with the right mouse button pressed (Shift-main mouse button on systems without a right mouse button). The translation is in the direction of the mouse movement, with a translation of 1% for each pixel of mouse movement.
The chart can also be translated using arrows keys (up, down, left, right). If the control key is also pressed, the motions are accelerated.
Zoom In or Zoom Out
The chart is zoomed when the mouse is moved with the middle mouse button pressed (or Alt-main mouse button on systems without a middle mouse button). The chart is zoomed by 1% for each pixel of mouse movement. Moving the mouse up moves the chart closer, moving the mouse down moves the chart further away.
The chart can also be zoomed using the plus (‘+’) or minus (‘-’) keys. The plus key zooms in and the minus key zooms out. If the control key is also pressed, the motions are accelerated.
Reset
Typing the Home key or the Equals (‘=’) key undoes any chart movements.