Surface Plot
The
Surface class is used to draw a surface. Surfaces can be specified either by an interface defining a function over a rectangle or by a set of points in three dimensions.
If a function defined over a rectangle is used, the function is evaluated on a rectangular grid of points. The resulting quadrilaterals are plotted.
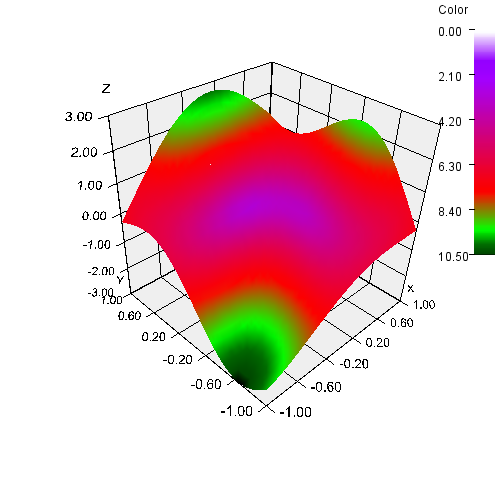
Shaded Surface
This example shades a surface with a user-specified function, instead of using shading. The same function is used as in the previous example: z = 2sin(x + y) - cos(2x - 3y) over the square [-1,1] by [-1,1].
The shade
Color function uses a
Colormap object from the
com.imsl.chart package. This maps a parameter to a
Color. In this example the surface is colored using the function
t = x
2 + y
2 + z
2.
The function value is scaled to a
Colormap parameter using
s =
t1/4/1.8.
The chart also includes a
ColormapLegend, which is drawn on the background. It is positioned 5 pixels from the right edge and 5 pixels from the top edge of the canvas (see
Canvas3DChart).
import com.imsl.chart3d.*;
import com.imsl.chart.Colormap;
public class SampleShadedSurface extends JFrameChart3D
implements Surface.ZFunction, ColorFunction {
private Colormap colormap = Colormap.GREEN_RED_BLUE_WHITE;
public SampleShadedSurface() {
Chart3D chart = getChart3D();
AxisXYZ axis = new AxisXYZ(chart);
Surface surface =
new Surface(axis, this, -1.0, 1.0, -1.0, 1.0);
surface.setColorFunction(this);
surface.setSurfaceType(Surface.SURFACE_TYPE_NICEST);
double maxColor = Math.pow(1.8,4);
ColormapLegend colormapLegend =
new ColormapLegend(chart, colormap, 0., maxColor);
colormapLegend.setTitle("Color");
colormapLegend.setPosition(-5, 5);
render();
}
public double f(double x, double y) {
return 2*Math.sin(x+y) - Math.cos(2*x-3*y);
}
public java.awt.Color color(double x, double y, double z) {
double t = x*x + y*y + z*z ;
double s = Math.pow(t, 0.25) / 1.8;
return colormap.color(s);
}
public static void main(String args[]) {
new SampleShadedSurface().setVisible(true);
}
}