Labels
Labels annotate data points. As a degenerate case they can be used to place text on a chart without drawing a point. Labels are controlled by the value of the attribute
LabelType in a
Data node.
Multiline labels are allowed.
Attribute LabelType
The attribute LabelType takes on one of the following values:
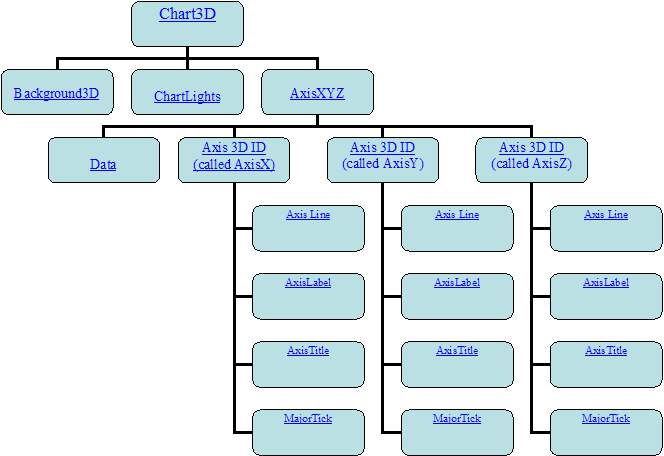
AxisXYZ
The
AxisXYZ node is the basis of both the scatter chart types and surface chart. Its parent node must be the root
Chart3D node.
When an
AxisXYZ node is created, it creates three
Axis3D nodes. They can be obtained by using the methods
AxisXYZ.getAxisX() and
AxisXYZ.getAxisY()and
AxisXYZ.getAxisZ(). Each of the Axis3D nodes in turn creates additional child nodes, as seen in the diagram below.
Accessor methods can be chained together, so the x-axis line can be retrieved using
axis.getAxisX().getAxisLine()
The code to set the x-axis line to blue is
axis.getAxisX().getAxisLine().setLineColor(Color.blue)
Axis Layout
The layout of an AxisXYZ chart is controlled by the attributes Window and Number.
Attribute Window
Window is a double array-valued attribute that contains the axis limits. Its value is (min, max).
Attribute Number
Number is an integer-valued attribute that contains the number of major tick marks along an axis.
Transform
The x-, y- and z-axes may be linear or logarithmic, as specified by the Transform attribute. This attribute can have the values:
Autoscale
Autoscaling is used to automatically determine the attribute Window (the range of numbers along an axis) and the attribute Number (the number of major tick marks). The goal is to adjust the attributes so that the data fits on the axes and the axes have “nice” numbers as labels.
Autoscaling is done in two phases. In the first (“input”) phase the actual range is determined. In the second (“output”) phase chart attributes are updated.
Attribute AutoscaleInput
The action of the input phase is controlled by the value of attribute AutoscaleInput in the axis node. It can have one of three values.
 AUTOSCALE_DATA
 scans the values in the
Data nodes that are attached to the axis to determine the data range. This is the default value.
AUTOSCALE_WINDOW uses the value of the
Window attribute to determine the data range.
Attribute AutoscaleOutput
The value of the AutoscaleOutput attribute can be the bitwise combination of the following values.
AUTOSCALE_NUMBER updates the value of the
Number attribute. This is the number of major tick marks along the axis.
AUTOSCALE_WINDOW updates the value of the
Window attribute. This is the range of numbers displayed along the axis.
The default is AUTOSCALE_NUMBER ∣ AUTOSCALE_WINDOW; both the attributes Number and Window are adjusted.