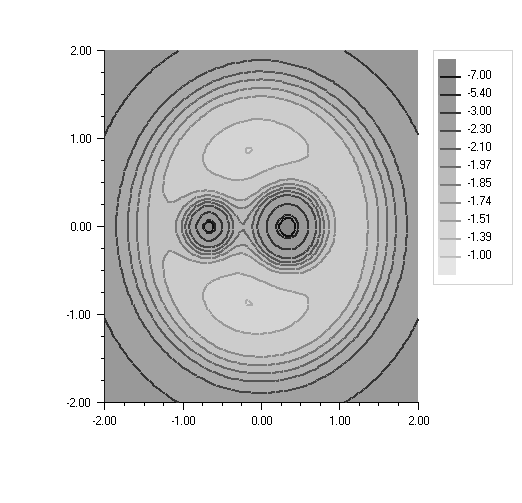
In the center-of-mass coordinate system, the effective potential energy of the system is given by
using Imsl.Chart2D;
using System;
using System.Windows.Forms;

public class ContourEx1 : FrameChart
{
	public ContourEx1()
	{
		Chart chart = this.Chart;

		int nx = 80;
		int ny = 80;

		// Allocate space
		double[] xGrid = new double[nx];
		double[] yGrid = new double[ny];
		double[,] zData = new double[nx,ny];

		// Setup the grids points
		for (int i = 0; i < nx; i++)
		{
			xGrid[i] = - 2 + 4.0 * i / (double) (nx - 1);
		}
		for (int j = 0; j < ny; j++)
		{
			yGrid[j] = - 2 + 4.0 * j / (double) (ny - 1);
		}

		// Evaluate the function at the grid points
		for (int i = 0; i < nx; i++)
		{
			for (int j = 0; j < ny; j++)
			{
				double x = xGrid[i];
				double y = yGrid[j];
				double rm = 0.5;
				double x1 = rm / (1.0 + rm);
				double x2 = x1 - 1.0;
				double d1 = System.Math.Sqrt((x - x1) * (x - x1) + y * y);
				double d2 = System.Math.Sqrt((x - x2) * (x - x2) + y * y);
				zData[i,j] = x2 / d1 - x1 / d2 - 0.5 * (x * x + y * y);
			}
		}

		// Create the contour chart, with user-specified levels and a legend
		AxisXY axis = new AxisXY(chart);
		double[] cLevel = new double[]{-7, -5.4, -3, -2.3, -2.1, -1.97, -1.85,
                                       -1.74, -1.51, -1.39, -1};
		Contour c = new Contour(axis, xGrid, yGrid, zData, cLevel);
		c.ContourLegend.IsVisible = true;

	}

	public static void Main(string[] argv)
	{
		System.Windows.Forms.Application.Run(new ContourEx1());
	}
}