Autoscaling does not properly handle time data, so autoscaling is turned off for the x (time) axis and the axis limits are set explicitly.
using Imsl.Chart2D;
using System;
using System.Windows.Forms;
public class HiLoEx1 : FrameChart
{
public HiLoEx1()
{
Chart chart = this.Chart;
AxisXY axis = new AxisXY(chart);
// Date is June 27, 1999
System.Globalization.GregorianCalendar temp_calendar;
temp_calendar = new System.Globalization.GregorianCalendar();
System.DateTime date = new DateTime(1999, 6, 27, temp_calendar);
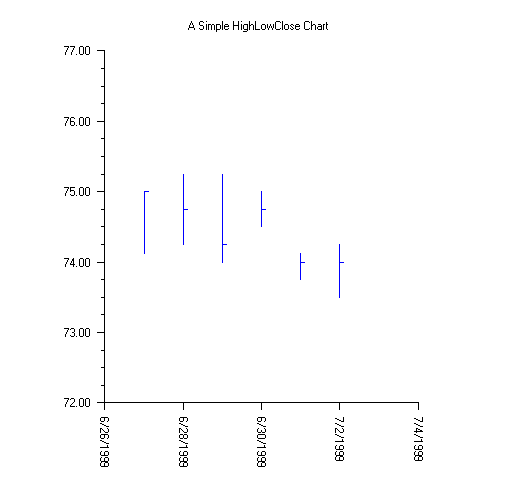
double[] high = new double[]{75.0, 75.25, 75.25, 75.0, 74.125, 74.25};
double[] low = new double[]{74.125, 74.25, 74.0, 74.5, 73.75, 73.50};
double[] close = new double[]{75.0, 74.75, 74.25, 74.75, 74.0, 74.0};
// Create an instance of a HighLowClose Chart
HighLowClose hilo = new HighLowClose(axis, date, high, low, close);
hilo.MarkerColor = System.Drawing.Color.Blue;
// Set the HighLowClose Chart Title
chart.ChartTitle.SetTitle("A Simple HighLowClose Chart");
// Configure the x-axis
hilo.SetDateAxis("d");
}
public static void Main(string[] argv)
{
System.Windows.Forms.Application.Run(new HiLoEx1());
}
}