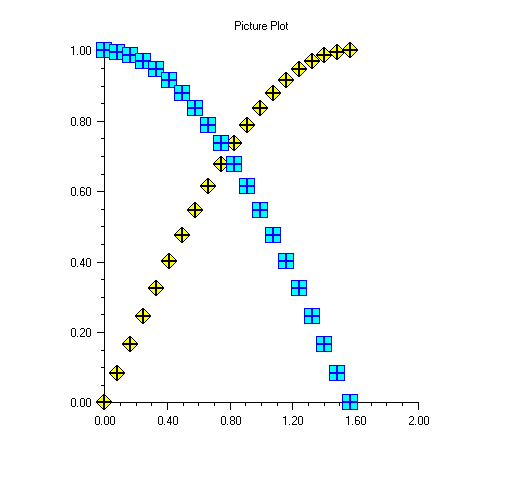
Example: Picture Chart
A picture plot is constructed in this example.
using Imsl.Chart2D;
using System;
using System.Windows.Forms;
using System.Drawing;

public class PictureEx1 : FrameChart
{

	public PictureEx1()
	{

		string appPath = Application.ExecutablePath;

		Chart chart = this.Chart;
		AxisXY axis = new AxisXY(chart);

		int npoints = 20;
		double dx = .5 * System.Math.PI / (npoints - 1);
		double[] x = new double[npoints];
		double[] y1 = new double[npoints];
		double[] y2 = new double[npoints];

		//	Generate some data
		for (int i = 0; i < npoints; i++)
		{
			x[i] = i * dx;
			y1[i] = System.Math.Sin(x[i]);
			y2[i] = System.Math.Cos(x[i]);
		}
		Data d1 = new Data(axis, x, y1);
		Data d2 = new Data(axis, x, y2);

		//	Load Images
		d1.DataType = Data.DATA_TYPE_PICTURE;
		d1.ImageAttr = new Bitmap(@"IMSL.NET\Example\Chart2D\marker.gif", true);
		d2.DataType = Data.DATA_TYPE_PICTURE;
		d2.ImageAttr = new Bitmap(@"IMSL.NET\Example\Chart2D\marker2.gif", true);

		//	Set the Chart Title
		chart.ChartTitle.SetTitle("Picture Plot");
	}

	public static void Main(string[] argv)
	{
		System.Windows.Forms.Application.Run(new PictureEx1());
	}
}
Output
Link to C# source.