IMSL C# Programmer’s Guide


IMSL C# Programmer’s Guide
|
Charting 2D Types >> Error Bar Plot |
|
Error Bar Plot
Error bars are used to indicate the estimated error in a measurement. Errors bars indicate the uncertainty in the x and/or y values.
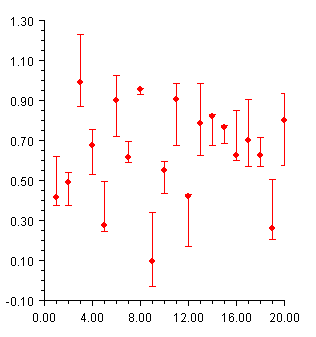
Vertical Error Bars
The most common error bar plot is one in which the errors are in the y-values. This example shows such an error bar plot. Note that the values of the low and high arguments are absolute y values, not relative or percentage values.
(Download Code)
using Imsl.Chart2D;
using System.Drawing;
using Imsl.Stat;

public class SampleErrorBar : FrameChart {

    public SampleErrorBar() {
        Random r = new Random(123457);

        Chart chart = this.Chart;
        AxisXY axis = new AxisXY(chart);

        // Generate a random data set, with random errors
        int n = 20;
        double[] x = new double[n];
        double[] y = new double[n];
        double[] low = new double[n];
        double[] high = new double[n];
        for (int k = 0;  k < n;  k++) {
            x[k] = k + 1;
            y[k] = r.NextDouble();
            low[k] = y[k] - 0.25*r.NextDouble();
            high[k] = y[k] + 0.25*r.NextDouble();
        }

        ErrorBar data = new ErrorBar(axis, x, y, low, high);
        data.DataType = ErrorBar.DATA_TYPE_ERROR_Y | Data.DATA_TYPE_MARKER;
        data.MarkerType = Data.MARKER_TYPE_FILLED_CIRCLE;
        data.MarkerColor = Color.Red;
    }

    public static void Main(string[] argv) {
        System.Windows.Forms.Application.Run(new SampleErrorBar());
    }
}
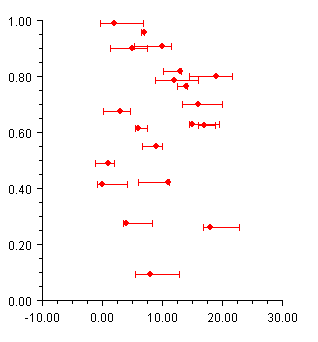
Horizontal Error Bars
It is also possible to have horizontal error bars, indicating errors in x, as shown in this example.
(Download Code)
using Imsl.Chart2D;
using System.Drawing;
using Imsl.Stat;

public class SampleHorizontalErrorBar : FrameChart {

    public SampleHorizontalErrorBar() {
        Random r = new Random(123457);

        Chart chart = this.Chart;
        AxisXY axis = new AxisXY(chart);

        // Generate a random data set, with random errors
        int n = 20;
        double[] x = new double[n];
        double[] y = new double[n];
        double[] low = new double[n];
        double[] high = new double[n];
        for (int k = 0;  k < n;  k++) {
            x[k] = k;
            y[k] = r.NextDouble();
            low[k] = x[k] - 5.0*r.NextDouble();
            high[k] = x[k] + 5.0*r.NextDouble();
        }

        ErrorBar data = new ErrorBar(axis, x, y, low, high);
        data.DataType = ErrorBar.DATA_TYPE_ERROR_X | Data.DATA_TYPE_MARKER;
        data.MarkerType = Data.MARKER_TYPE_FILLED_CIRCLE;
        data.MarkerColor = Color.Red;
    }

    public static void Main(string[] argv) {
        System.Windows.Forms.Application.Run(new SampleHorizontalErrorBar());
    }
}
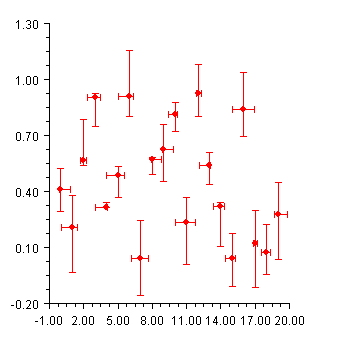
Mixed Error Bars
To show errors in both x and y, it is necessary to create both vertical and horizontal error bar objects. This example shows such a chart.
using Imsl.Chart2D;
using System.Drawing;
using Imsl.Stat;

public class SampleMixedErrorBar : FrameChart {

    public SampleMixedErrorBar() {
        Random r = new Random(123457);

        Chart chart = this.Chart;
        AxisXY axis = new AxisXY(chart);

        // Generate a random data set, with random errors
        int n = 20;
        double[] x = new double[n];
        double[] y = new double[n];
        double[] xlow = new double[n];
        double[] xhigh = new double[n];
        double[] ylow = new double[n];
        double[] yhigh = new double[n];
        for (int k = 0;  k < n;  k++) {
            x[k] = k;
            y[k] = r.NextDouble();
            xlow[k] = x[k] - r.NextDouble();
            xhigh[k] = x[k] + r.NextDouble();
            ylow[k] = y[k] - 0.25*r.NextDouble();
            yhigh[k] = y[k] + 0.25*r.NextDouble();
        }

        ErrorBar dataY = new ErrorBar(axis, x, y, ylow, yhigh);
        dataY.DataType = ErrorBar.DATA_TYPE_ERROR_Y | Data.DATA_TYPE_MARKER;
        dataY.MarkerType = Data.MARKER_TYPE_FILLED_CIRCLE;
        dataY.MarkerColor = Color.Red;

        ErrorBar dataX = new ErrorBar(axis, x, y, xlow, xhigh);
        dataX.DataType = ErrorBar.DATA_TYPE_ERROR_X;
        dataX.MarkerType = Data.MARKER_TYPE_FILLED_CIRCLE;
        dataX.MarkerColor = Color.Red;
    }

    public static void Main(string[] argv) {
        System.Windows.Forms.Application.Run(new SampleMixedErrorBar());
    }
}
| © Visual Numerics, Inc. All rights reserved. |
|