Programmer’s Guide


| IMSL C# Chart Programmer’s Guide | Picture-in-Picture |
|
Picture-in-Picture
The picture-in-picture effect can be obtained by using the Viewport attribute.
This sets the fraction of the screen into which the chart is to be drawn. The Viewport
attribute’s value is a double[4] containing {xmin, xmax, ymin, ymax}, on a
[0,1] by [0,1] grid with (0,0) at the top-left.
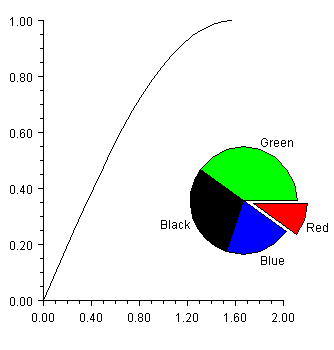
This chart tree for the above picture consists of a chart with an AxisXY child and
a Pie child. (The Pie class is a subclass of Axis.) The Viewport attribute of the
Pie node is set to a non-default value.
(Download Code)
using System;
using System.Windows.Forms;
using System.Drawing;
using Imsl.Chart2D;

public class SamplePnP : FrameChart
{
    public SamplePnP()
    {
        Chart chart = this.Chart;
        CreateLineChart(chart);
        CreatePieChart(chart);
    }

    private void CreateLineChart(Chart chart) {
        AxisXY axis = new AxisXY(chart);

        int npoints = 20;
        double dx = 0.5 * Math.PI/(npoints-1);
        double[] x = new double[npoints];
        double[] y = new double[npoints];
        for (int i = 0;  i < x.Length;  i++){
            x[i] = i * dx;
            y[i] = Math.Sin(x[i]);
        }
        new Data(axis, x, y);
    }

    private void CreatePieChart(Chart chart) {
        double[] y = new double[] {10, 20, 30, 40};
        Pie pie = new Pie(chart, y);
        pie.LabelType = Pie.LABEL_TYPE_TITLE;
        pie.SetViewport(0.5, 0.9, 0.3, 0.8);

        PieSlice[] slice = pie.GetPieSlice();

        slice[0].SetTitle(“Red”);
        slice[0].FillColor = Color.Red;
        slice[0].Explode = 0.2;

        slice[1].SetTitle(“Blue”);
        slice[1].FillColor = Color.Blue;

        slice[2].SetTitle(“Black”);
        slice[2].FillColor = Color.Black;

        slice[3].SetTitle(“Green”);
        slice[3].FillColor = Color.Green;
    }

    public static void Main(string[] argv)
    {
        System.Windows.Forms.Application.Run(new SamplePnP());
    }
}
| © Visual Numerics, Inc. All rights reserved. |
|