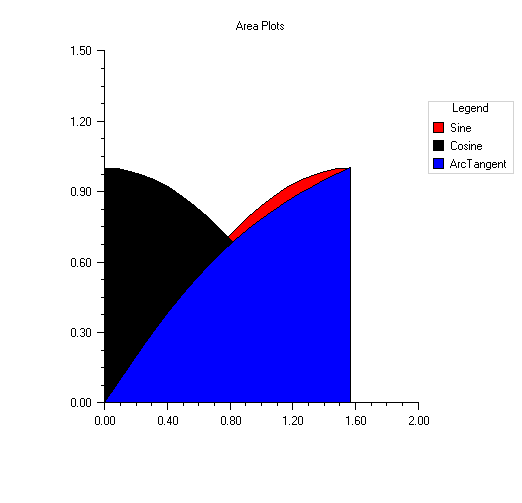
Example: Area Chart
An area chart is constructed in this example. Three data sets are used and a legend is added to the chart.
using Imsl.Chart2D;
using System;
using System.Windows.Forms;

public class AreaEx1 : FrameChart
{
    public AreaEx1()
    {
        Chart chart = this.Chart;
        AxisXY axis = new AxisXY(chart);

        int npoints = 20;
        double dx = .5 * System.Math.PI / (npoints - 1);
        double[] x = new double[npoints];
        double[] y1 = new double[npoints];
        double[] y2 = new double[npoints];
        double[] y3 = new double[npoints];

        //    Generate some data
        for (int i = 0; i < npoints; i++)
        {
            x[i] = i * dx;
            y1[i] = System.Math.Sin(x[i]);
            y2[i] = System.Math.Cos(x[i]);
            y3[i] = System.Math.Atan(x[i]);
        }
        Data d1 = new Data(axis, x, y1);
        Data d2 = new Data(axis, x, y2);
        Data d3 = new Data(axis, x, y3);

        //    Set Data Type to Fill Area
        axis.DataType = Imsl.Chart2D.Data.DATA_TYPE_FILL;

        //    Set Line Colors
        d1.LineColor = System.Drawing.Color.Red;
        d2.LineColor = System.Drawing.Color.Black;
        d3.LineColor = System.Drawing.Color.Blue;

        //    Set Fill Colors
        d1.FillColor = System.Drawing.Color.Red;
        d2.FillColor = System.Drawing.Color.Black;
        d3.FillColor = System.Drawing.Color.Blue;

        //    Set Data Labels
        d1.SetTitle("Sine");
        d2.SetTitle("Cosine");
        d3.SetTitle("ArcTangent");

        //    Add a Legend
        Legend legend = chart.Legend;
        legend.SetTitle(new Text("Legend"));
        legend.IsVisible = true;

        //    Set the Chart Title
        chart.ChartTitle.SetTitle("Area Plots");
    }

    public static void Main(string[] argv)
    {
        System.Windows.Forms.Application.Run(new AreaEx1());
    }
}
Output
Link to C# source.