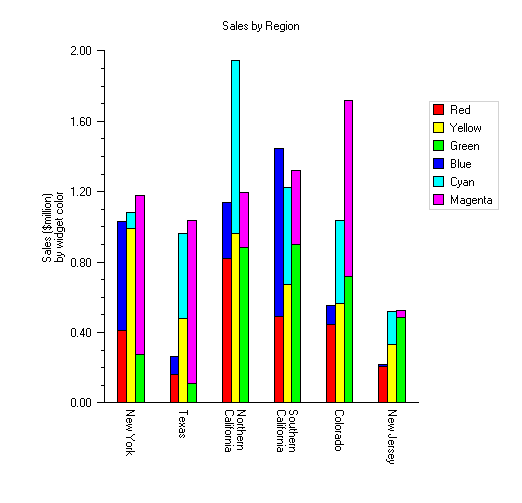
Example: Stacked Bar Chart
A stacked bar chart is constructed in this example. Bar labels and colors are set and axis labels are set.
using Imsl.Chart2D;
using System;
using System.Windows.Forms;

public class BarEx1 : FrameChart
{

    public BarEx1()
    {
        Chart chart = this.Chart;
        AxisXY axis = new AxisXY(chart);

        int nStacks = 2;
        int nGroups = 3;
        int nItems = 6;

        //    Generate some random data
        Imsl.Stat.Random r = new Imsl.Stat.Random(123457);

        double[] dbl = new double[50];
        dbl[0]=0.41312962995625035;
        dbl[1]=0.15995876895053263;
        dbl[2]=0.8225528716547005;
        dbl[3]=0.48794367683379836;
        dbl[4]=0.44364905186692527;
        dbl[5]=0.20896329070872555;
        dbl[6]=0.9887088342522812;
        dbl[7]=0.4781765623804778;
        dbl[8]=0.9647868112234352;
        dbl[9]=0.6732389937186418;
        dbl[10]=0.5668831243079411;
        dbl[11]=0.33081942994459734;
        dbl[12]=0.27386697614898103;
        dbl[13]=0.10880787186704965;
        dbl[14]=0.8805853693809824;
        dbl[15]=0.901138442534768;
        dbl[16]=0.7180829622748057;
        dbl[17]=0.48723656383264413;
        dbl[18]=0.6153607537410654;
        dbl[19]=0.10153552805288812;
        dbl[20]=0.3158193853638753;
        dbl[21]=0.9558058275075961;
        dbl[22]=0.10778543304578747;
        dbl[23]=0.011829287599608884;
        dbl[24]=0.09275375134615693;
        dbl[25]=0.4859902873228249;
        dbl[26]=0.9817642781628322;
        dbl[27]=0.5505301300240635;
        dbl[28]=0.467363186309925;
        dbl[29]=0.18652444274911184;
        dbl[30]=0.9066980293517674;
        dbl[31]=0.9272326533193322;
        dbl[32]=0.31440695305815347;
        dbl[33]=0.4215880116306273;
        dbl[34]=0.9991560762956562;
        dbl[35]=0.0386317648903991;
        dbl[36]=0.785150345014761;
        dbl[37]=0.6451521871931544;
        dbl[38]=0.7930129038729785;
        dbl[39]=0.819301055474355;
        dbl[40]=0.5695413465811706;
        dbl[41]=0.039285689951912395;
        dbl[42]=0.7625752595574732;
        dbl[43]=0.31325564481720314;
        dbl[44]=0.0482465474704169;
        dbl[45]=0.6272275622766595;
        dbl[46]=0.09904819350827354;
        dbl[47]=0.8934533907186641;
        dbl[48]=0.7013979421419555;
        dbl[49]=0.5212913217641422;

        int z=0;

        double[] x = new double[nItems];
        double[][][] y = new double[nStacks][][];
        for (int i = 0; i < nStacks; i++)
        {
            y[i] = new double[nGroups][];
            for (int i2 = 0; i2 < nGroups; i2++)
            {
                y[i][i2] = new double[nItems];
            }
        }
        double dx = 0.5 * System.Math.PI / (x.Length - 1);
        for (int istack = 0; istack < y.Length; istack++)
        {
            for (int jgroup = 0; jgroup < y[istack].Length; jgroup++)
            {
                for (int kitem = 0; kitem < y[istack][jgroup].Length; kitem++)
                {
                    y[istack][jgroup][kitem] = dbl[z];//r.NextDouble();
                    z++;
                }
            }
        }

        //    Create an instance of a Bar Chart
        Bar bar = new Bar(axis, y);

        //    Set the Bar Chart Title
        chart.ChartTitle.SetTitle("Sales by Region");

        //    Set the fill outline type;
        bar.FillOutlineType = Bar.FILL_TYPE_SOLID;

        System.Drawing.Color GREEN = System.Drawing.Color.FromArgb(0, 255, 0);
        //    Set the Bar Item fill colors
        bar.GetBarSet(0, 0).FillColor = System.Drawing.Color.Red;
        bar.GetBarSet(0, 1).FillColor = System.Drawing.Color.Yellow;
        bar.GetBarSet(0, 2).FillColor = GREEN;
        bar.GetBarSet(1, 0).FillColor = System.Drawing.Color.Blue;
        bar.GetBarSet(1, 1).FillColor = System.Drawing.Color.Cyan;
        bar.GetBarSet(1, 2).FillColor = System.Drawing.Color.Magenta;

        chart.Legend.IsVisible = true;
        bar.GetBarSet(0, 0).SetTitle("Red");
        bar.GetBarSet(0, 1).SetTitle("Yellow");
        bar.GetBarSet(0, 2).SetTitle("Green");
        bar.GetBarSet(1, 0).SetTitle("Blue");
        bar.GetBarSet(1, 1).SetTitle("Cyan");
        bar.GetBarSet(1, 2).SetTitle("Magenta");

        // Setup the vertical axis for a labeled bar chart.
        System.String[] labels = new System.String[]{"New York", "Texas",
         "Northern\nCalifornia", "Southern\nCalifornia", "Colorado",
         "New Jersey"};
        bar.SetLabels(labels, Imsl.Chart2D.Bar.BAR_TYPE_VERTICAL);

        //    Set the text angle
        axis.AxisX.AxisLabel.TextAngle = 270;

        //    Set the Y axis title
        axis.AxisY.AxisTitle.SetTitle("Sales ($million)\nby " + "widget color");

    }

    public static void Main(string[] argv)
    {
        System.Windows.Forms.Application.Run(new BarEx1());
    }
}
Output

Link to C# source.
