Example: c-chart
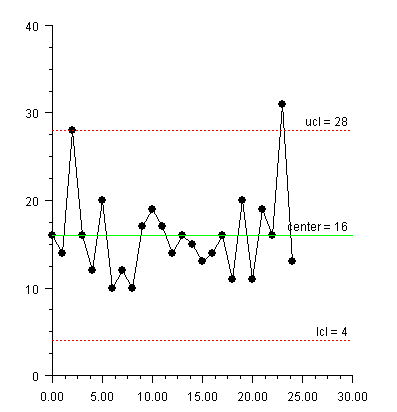
The number of defects on each of 25 successive wafers is plotted. The data is from NIST Engineering Statistics Handbook: Counts Control Charts
.
using Imsl.Chart2D;
using Imsl.Chart2D.QC;
using System;

public class CChartEx1 : FrameChart
{
	static private readonly int[] numberOfDefects = {
		16, 14, 28, 16, 12, 20, 10, 12, 10, 17, 19, 17, 14, 16, 15, 13,
		14, 16, 11, 20, 11, 19, 16, 31, 13
	};

	public CChartEx1()
	{
		AxisXY axis = new AxisXY(this.Chart);
		new CChart(axis, numberOfDefects);
	}

	public static void Main(string[] argv)
	{
		System.Windows.Forms.Application.Run(new CChartEx1());
	}
}
Output
Link to C# source.