Example: p-Chart
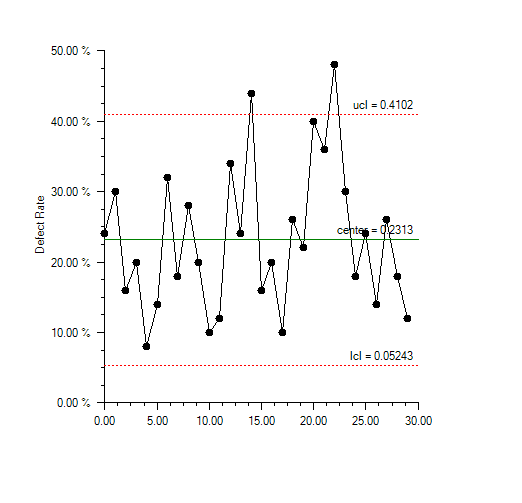
The location of 50 chips on each of 30 successive wafers is measured. The number of defects is the number of horizontal or vertical misregistrations of chips. The data is from NIST Engineering Statistics Handbook: Proportions Control Charts
.
using Imsl.Chart2D;
using Imsl.Chart2D.QC;
using System;

public class PChartEx1 : FrameChart
{
	static private readonly double[] defectRate = {
		0.24, 0.3, 0.16, 0.2, 0.08, 0.14, 0.32, 0.18, 0.28, 0.2,
		0.1, 0.12, 0.34, 0.24, 0.44, 0.16, 0.2, 0.1, 0.26, 0.22,
		0.4, 0.36, 0.48, 0.3, 0.18, 0.24, 0.14, 0.26, 0.18, 0.12
	};
	static private readonly int sampleSize = 50;

	public PChartEx1()
	{
		AxisXY axis = new AxisXY(this.Chart);
		axis.AxisY.AxisTitle.SetTitle("Defect Rate");
		axis.AxisY.AxisLabel.TextFormat = "P";
		new PChart(axis, sampleSize, defectRate);
	}

	public static void Main(string[] argv)
	{
		System.Windows.Forms.Application.Run(new PChartEx1());
	}
}
Output
Link to C# source.