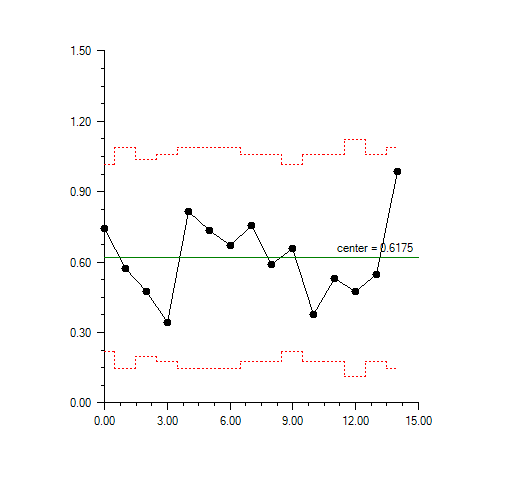
During a manufacturing process 15 samples, each containing up to 12 items, were measured. An S chart was contructed from the 15 sample standard deviations. Since the sample sizes are unequal the upper and lower control limit lines are stair step lines.
using Imsl.Chart2D;
using Imsl.Chart2D.QC;
using System;

public class SChartEx1 : FrameChart
{
	static private double[][] data = {
		new double[]{23.97, 24.08, 23.16, 23.49, 24.73, 25.26, 22.97, 23.12, 24.66,
						24.20, 24.62, 24.56},
		new double[]{24.20, 24.50, 23.45, 24.05, 23.75, 23.89, 24.83, 25.21, 23.70},
		new double[]{23.73, 22.70, 23.54, 24.37, 23.74, 24.08, 23.95, 24.20, 23.43,
						24.26, 23.61},
		new double[]{23.46, 23.14, 23.73, 24.29, 24.13, 23.62, 24.08, 23.73, 23.91,
						23.65},
		new double[]{23.95, 22.95, 24.72, 24.40, 22.82, 22.66, 22.71, 23.41, 22.56},
		new double[]{24.13, 24.28, 23.84, 24.55, 22.58, 24.47, 23.63, 22.64, 24.12},
		new double[]{23.69, 24.19, 24.76, 23.83, 22.60, 24.35, 22.96, 23.81, 23.46},
		new double[]{24.35, 23.11, 25.24, 24.10, 23.47, 23.55, 23.91, 24.08, 22.45,
						24.13},
		new double[]{24.98, 24.58, 23.52, 23.55, 23.67, 24.25, 23.85, 23.08, 23.44,
						23.43},
		new double[]{23.90, 24.04, 24.29, 23.62, 23.29, 23.16, 24.34, 24.37, 24.19,
						24.33, 22.17, 23.66},
		new double[]{23.51, 23.87, 23.29, 23.96, 23.06, 23.47, 23.53, 22.87, 23.38,
						22.86},
		new double[]{23.13, 23.17, 23.40, 23.68, 23.37, 24.40, 24.64, 24.16, 24.17,
						23.88},
		new double[]{23.52, 24.23, 24.25, 23.83, 22.82, 23.93, 23.55, 23.40},
		new double[]{23.66, 23.59, 23.79, 24.07, 23.65, 23.73, 25.12, 23.65, 23.23,
						23.13},
		new double[]{23.04, 23.75, 22.84, 23.46, 21.72, 24.73, 23.88, 23.34, 24.98}
	 };

	public SChartEx1()
	{
		AxisXY axis = new AxisXY(this.Chart);
		new SChart(axis, data);
	}

	public static void Main(string[] argv)
	{
		System.Windows.Forms.Application.Run(new SChartEx1());
	}
}