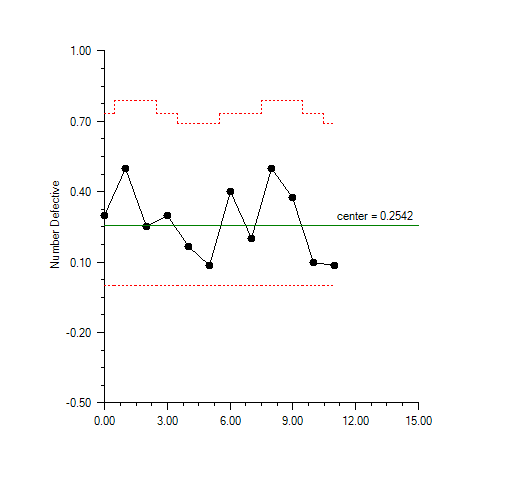
The number of defects in each of 12 samples was counted. The number of items in the samples varied from 8 to 12.
using Imsl.Chart2D;
using Imsl.Chart2D.QC;
using System;

public class UChartEx1 : FrameChart
{
	static private readonly int[] numberDefects = {
		3, 4, 2, 3, 2, 1, 4, 2, 4, 3, 1, 1
	};
	static private readonly double[] sizeSample = {
		10, 8, 8, 10, 12, 12, 10, 10, 8, 8, 10, 12
	};

	public UChartEx1()
	{
		AxisXY axis = new AxisXY(this.Chart);
        axis.AxisY.AxisTitle.SetTitle("Number Defective");
		new UChart(axis, sizeSample, numberDefects);
	}

	public static void Main(string[] argv)
	{
		System.Windows.Forms.Application.Run(new UChartEx1());
	}
}