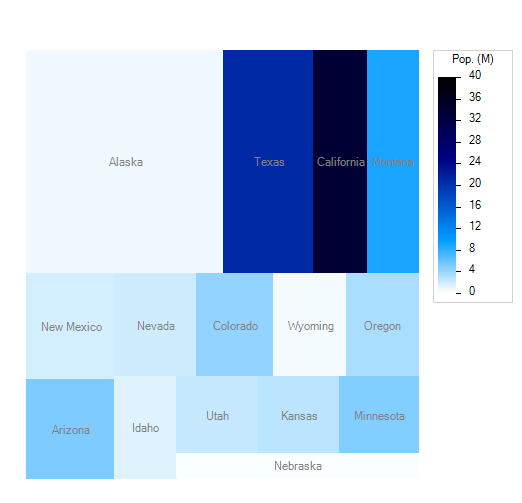
Example: Treemap with sorted data
A treemap is constructed from area and population data of the 15 largest US states. Each rectangle is proportional to the state's area (in square miles) and is shaded by its population (in millions).
using Imsl.Chart2D;
using System;
using System.Windows.Forms;

public class TreemapEx1 : FrameChart
{
    public TreemapEx1()
    {
        Chart chart = this.Chart;
        AxisXY axis = new AxisXY(chart);

        double[] areas = {570374, 261914, 155973, 145556, 121364,
                             113642, 109806, 103729, 97105, 96002,
                             82751, 82168, 81823, 79617, 76878};

        double[] population = {0.626932, 20.851820, 33.871648, 9.02195,
                               1.819046, 5.130632, 1.998257, 4.301261,
                               0.493782, 3.421399, 1.293953, 2.233169,
                               2.688418, 4.919479, 0.1711263};

        string[] names = {"Alaska", "Texas", "California", "Montana",
                          "New Mexico", "Arizona", "Nevada", "Colorado",
                          "Wyoming", "Oregon", "Idaho", "Utah", "Kansas",
                          "Minnesota", "Nebraska"};

        Treemap treemap = new Treemap(axis, areas, population,
            Colormap_Fields.BLUE_WHITE);
        treemap.SetZRange(new double[]{0, 40});
        treemap.SetTreemapLabels(names);
        treemap.TextColor = System.Drawing.Color.Gray;
        treemap.TreemapLegend.IsVisible = true;
        treemap.TreemapLegend.SetTitle("Pop. (M)");
        treemap.TreemapLegend.TextFormat = "0";
        axis.SetViewport(0.05, 0.8, 0.1, 0.95);
    }

    public static void Main(string[] argv)
    {
        System.Windows.Forms.Application.Run(new TreemapEx1());
    }
}
Output
Link to C# source.