Grid
The Grid node controls the drawing of grid lines on a chart. The Grid is created by Axis1D as its child. It can be retrieved using the property Axis1D.Grid.
By default, Grid nodes are not drawn. To enable them, set their IsVisible property to true. Grid nodes control the drawing of the grid lines perpendicular to their parent axis. So the x-axis Grid node controls the drawing of the vertical grid lines.
Example
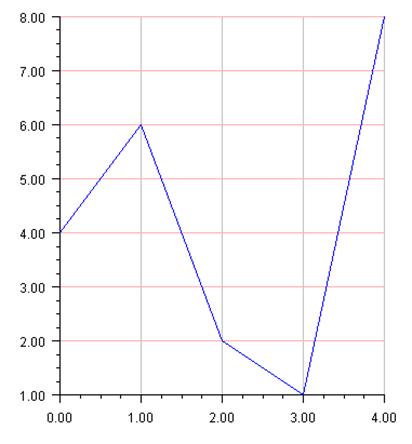
In this example, the x-axis grid lines are painted light gray and the y-axis grid lines are pink.
using Imsl.Chart2D;
using System.Drawing;
public class SampleGrid : FrameChart {
public SampleGrid() {
Chart chart = this.Chart;
AxisXY axis = new AxisXY(chart);
axis.AxisX.Grid.IsVisible = true;
axis.AxisY.Grid.IsVisible = true;
axis.AxisX.Grid.LineColor = Color.LightGray;
axis.AxisY.Grid.LineColor = Color.Pink;
double[] y = {4, 6, 2, 1, 8};
Data data = new Data(axis, y);
data.DataType = Data.DATA_TYPE_LINE;
data.LineColor = Color.Blue;
}
public static void Main(string[] argv) {
System.Windows.Forms.Application.Run(new SampleGrid());
}
}
|
PHONE: 713.784.3131 FAX:713.781.9260 |