NpChart
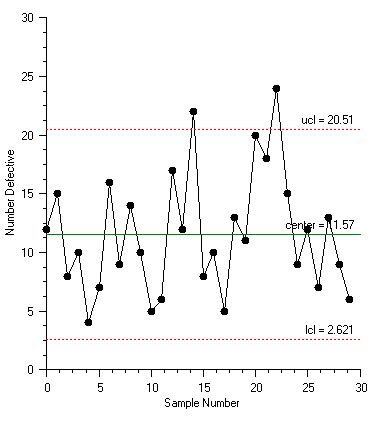
NpChart is similar to PChart, except that the number of defects per sample is plotted, not the sample rate. The position of the control limits are given by


where n is the number of items and p is the proportion of defective items.
NpChart Example
This example uses the orange juice can manufacturing data used earlier in the PChart example. In this example, the number of defects, rather than the defect rate is plotted.
using Imsl.Chart2D;
using Imsl.Chart2D.QC;
public class SampleNpChart : FrameChart {
static int sampleSize = 50;
static int[] numberDefects = {
12, 15, 8, 10, 4, 7, 16, 9, 14, 10, 5, 6, 17, 12, 22, 8,
10, 5, 13, 11, 20, 18, 24, 15, 9, 12, 7, 13, 9, 6
};
public SampleNpChart() {
Chart chart = this.Chart;
AxisXY axis = new AxisXY(chart);
NpChart npchart = new NpChart(axis, sampleSize, numberDefects);
axis.AxisX.AxisTitle.SetTitle("Sample Number");
axis.AxisX.AxisLabel.TextFormat = "0";
axis.AxisY.AxisTitle.SetTitle("Number Defective");
}
public static void Main(string[] argv) {
System.Windows.Forms.Application.Run(new SampleNpChart());
}
}
|
PHONE: 713.784.3131 FAX:713.781.9260 |