A Treemap divides a rectangle into subrectangles. The size of each rectangle is determined by an array of data values. The color of each subrectangle is determined by the value of a second data array and a Colormap.
The primary data array is a sorted set of values to map to the subrectangle areas. The placement algorithm is adapted from Bruls, Mark and Huizing, Kees and Wijk, Jarke J. van (2000) Squarified Treemaps. In Proceedings of the Joint Eurographics and IEEE TCVG Symposium on Visualization.
By default, the algorithm fills either rows first or columns first determined by the aspect ratio of the resulting subrectangles. The user may force drawing orientation by using the Orientation property with Treemap.OrientationMethod.ColumnFirst or Treemap.OrientationMethod.RowFirst.
A Colormap is a mapping from [0,1] to color values. The Treemap maps the minimum value of the second data array to the color corresponding to 0 and the highest value to the color corresponding to 1.
The TreemapLegend is enabled by setting its IsVisible property to true.
Example
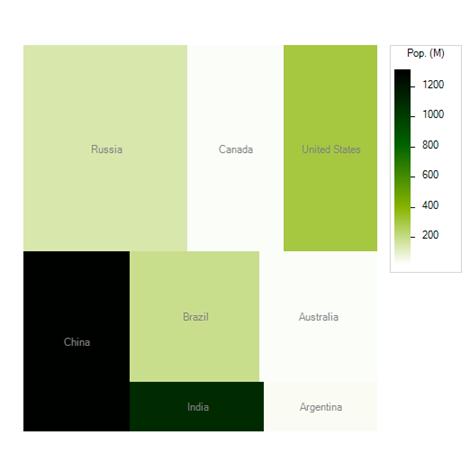
In this example an array of country data is plotted as a Treemap. The area is proportional to the country’s land area while the shading maps to the population. The “green-white-linear” Colormap is used. The TreemapLegend is enabled by setting its IsVisible property to true.
using Imsl.Chart2D;
using System.Drawing;
public class SampleTreemap : FrameChart {
public SampleTreemap() {
Chart chart = this.Chart;
AxisXY axis = new AxisXY(chart);
double[] areas = {
6592735, 3855081, 3718691, 3705386,
3286470, 2967893, 1269338, 1068296};
double[] population = {
142.893540, 33.098932, 298.444215, 1313.973713,
188.078227, 20.264082, 1095.351995, 39.930091};
string[] names = {
"Russia", "Canada", "United States", "China",
"Brazil", "Australia", "India", "Argentina"};
Treemap treemap = new Treemap(axis, areas, population,
Colormap_Fields.GREEN_WHITE_LINEAR);
treemap.SetTreemapLabels(names);
treemap.TextColor = Color.Gray;
treemap.TreemapLegend.IsVisible = true;
treemap.TreemapLegend.SetTitle("Pop. (M)");
treemap.TreemapLegend.TextFormat = "0";
axis.SetViewport(0.05, 0.8, 0.1, 0.95);
}
public static void Main(string[] argv) {
System.Windows.Forms.Application.Run(new SampleTreemap());
}
}
|
PHONE: 713.784.3131 FAX:713.781.9260 |